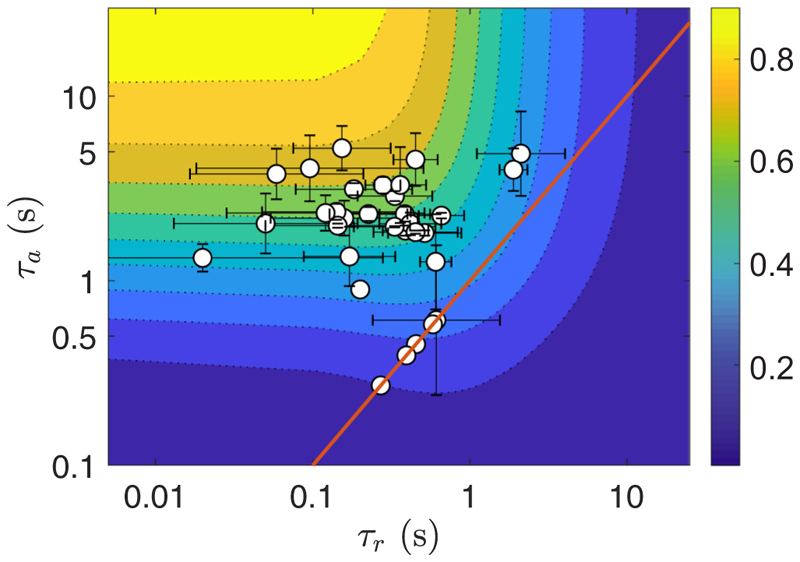
Fig. 10.
Experimental characteristic times (τr, τa) of the adaptive model. Data obtained from the flagella beat frequencies averaged for each colony (sample size: 34 colonies). Background color shows the gain function 𝒢 defined in Appendix F, Eq. (F8). Red line indicates the relation τr = τa.

