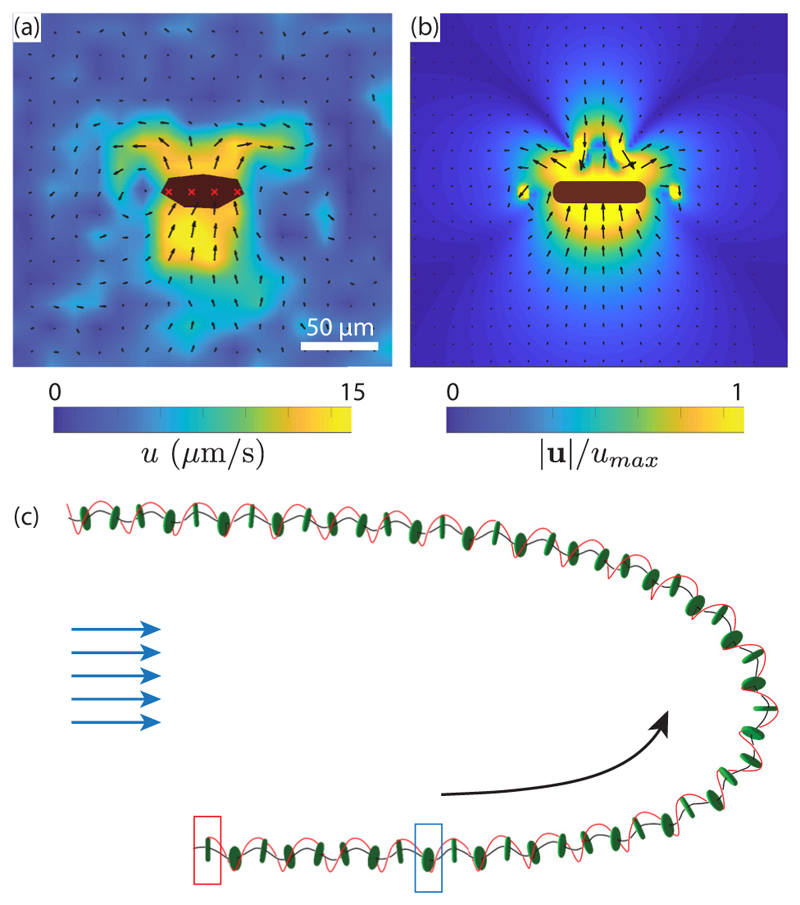
Fig. 5. Photoresponse of Gonium.
[(a) and (b)] Flow fields around a colony swimming toward the top of the image in the laboratory frame. (a) Micro-PIV measurements (the body is in black with red crosses). The background color shows the norm of the velocity, varying here up to 15 µm/s. Scale bar is 50 µm. (b) Numerical flow field using the point-force model. (c) Wavy trajectory of a colony, numerically computed for ξ = 0.4 and µs0 = 0.5. The initial position is shown by the red rectangle, and the time when light is switched on from the left is indicated by the blue rectangle. Black line shows the trajectory, and the red line follows the position of the point of maximal force, α = 0, highlighting rotation of the body.

