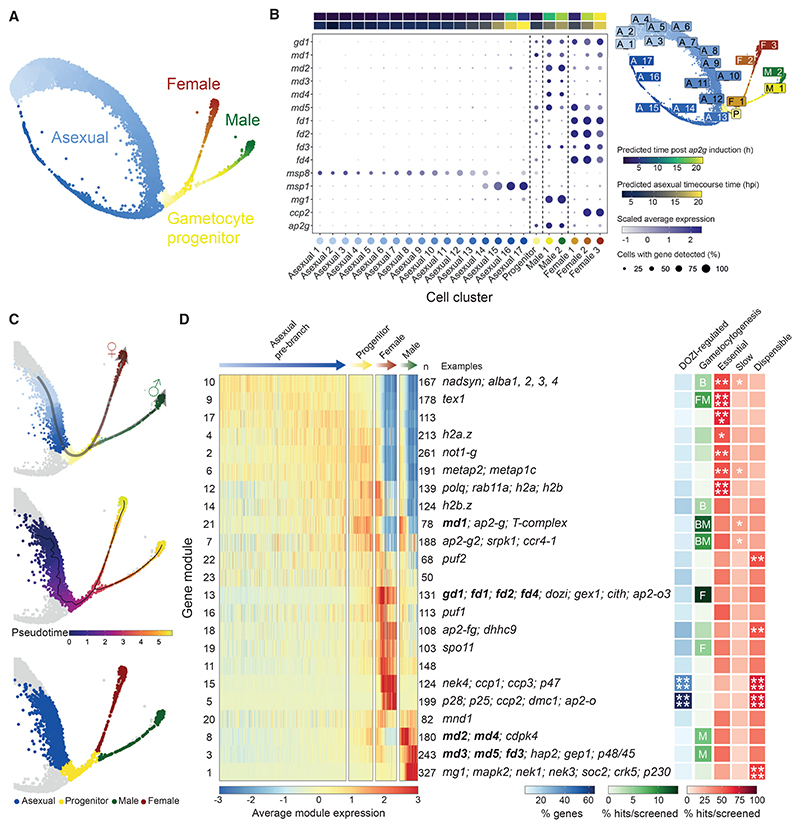
Figure 3. Combined analysis of wild-type 10x and Smart-seq2 transcriptomes from P. berghei-infected mouse red blood cells.
(A) UMAP plot of all 6,880 wild-type cells (Smart-seq2 and 10x), colored by their assigned sex designation and progression along development.
(B) Dot plot showing expression of known marker genes alongside the candidate genes in 23 cell clusters. The estimated average time point of each cluster is annotated by correlating single-cell data to bulk time course data (this study and another study conducted by Hoo et al.24). Cluster locations are shown on the UMAP plot (top right).
(C) Wild-type cells were sub-clustered and 10x-only cells (non-gray dots) were selected in order to re-calculate pseudotime for the branches of interest and construct modules of genes that are co-expressed over pseudotime. These selected cells are colored by sex assignments (bottom), recalculated pseudotime values (middle), and a composite of sex assignments and pseudotime (top), superimposed on the UMAP in (A). Non-branch cells are colored gray.
(D) Heatmap showing the scaled average expression of gene modules in cells shown in (C). n, the number of genes per module; DOZI-regulated, % of DOZI-regulated genes within each cluster according to Guerreiro et al.25 M, F, and B represent significant (p ≤ 0.05) enrichment of screen phenotype in males only, females only, or both sexes, respectively. Essential, Slow, Dispensable, % genes per cluster with asexual blood-stage phenotype according to Bushell et al.16 Significance of enrichment: * p ≤ 0.05; ** p ≤ 0.01; *** p ≤ 0.001; **** p ≤ 0.0001. See Figure 5 for details. Exemplary genes for each cluster are shown.

