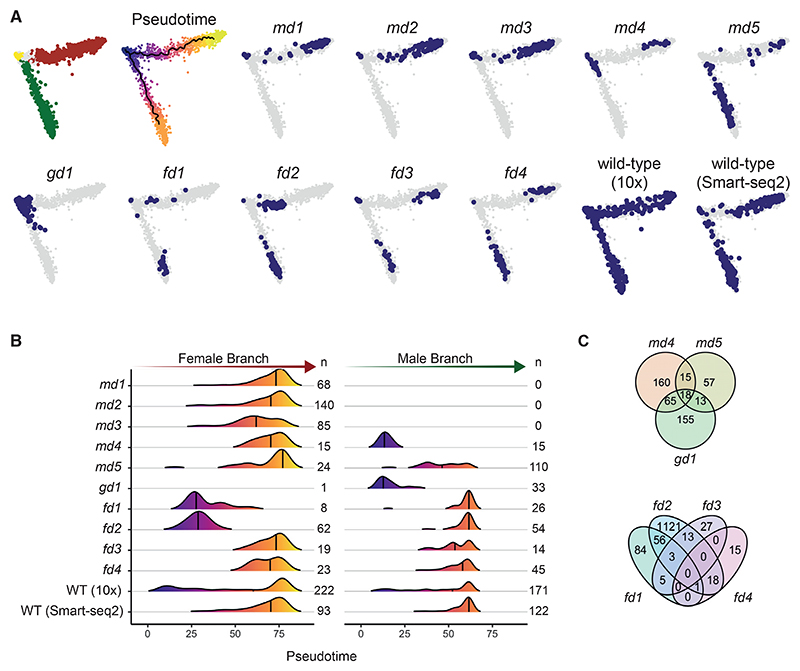
Figure 4. Smart-seq2 analysis of in vitro-matured wild-type and mutant parasites.
(A) Principal-component analysis (PCA) plots of 3,012 transcriptomes from single parasitized red blood cells of the sexual branch that were obtained by merging all wild-type and mutant cells and subsetting the branch of interest (Figure S5).
(B) Density plots showing the distribution of assigned female (left) and male (right) cells along each pseudotime trajectory and grouped by genotype. n, the number of cells for each condition as shown in (A). WT, wild type. The line indicates the median.
(C) Venn diagrams showing the numbers of genes with differences in transcript abundance in female and male gametocytes, respectively, relative to wild-type. Genes that result in the absence of a sex cannot be evaluated.

