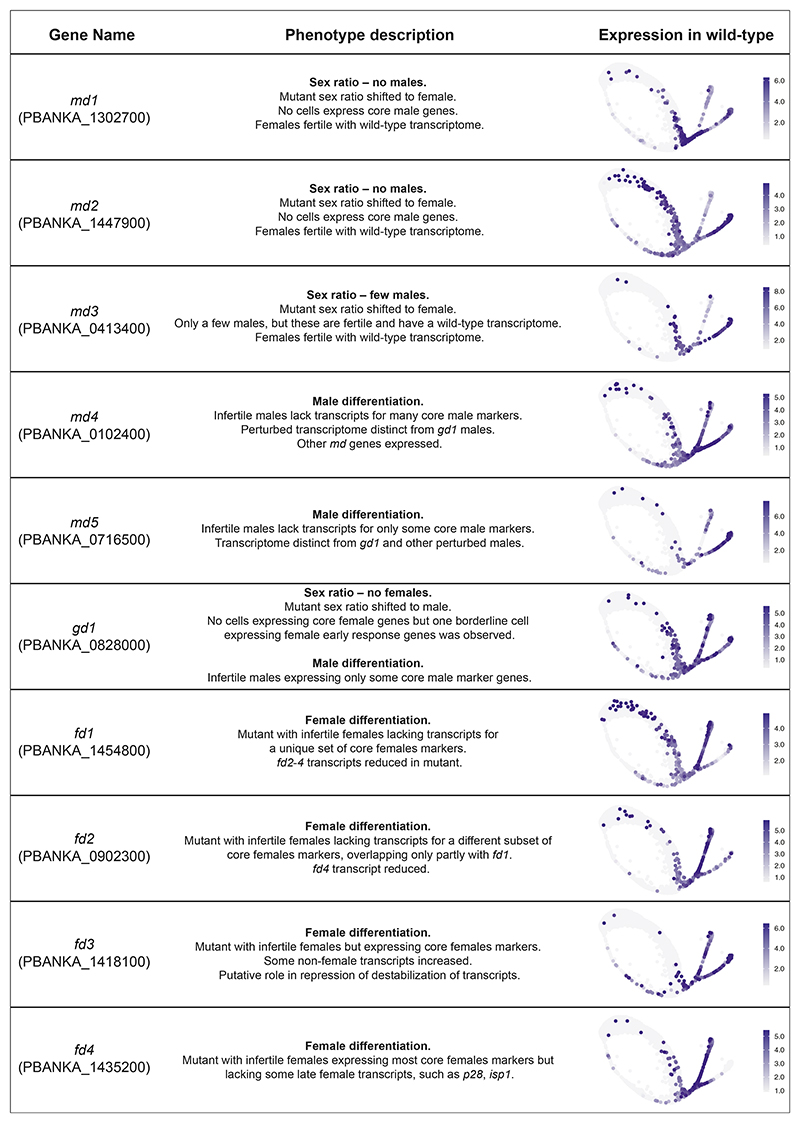
Figure 5. Summary data from Smart-seq2 experiments of mutants.
A description of the phenotype observed from the single-cell RNA-seq data is given along with a summary of the fertility phenotype (Figures 2E–2G). On the right-hand side, the scaled expression of the gene in wild-type only cells is shown with the 5th and 95th quantiles set as the minimum and maximum expression values, respectively, to eliminate any outliers having a strong influence on visualization.

