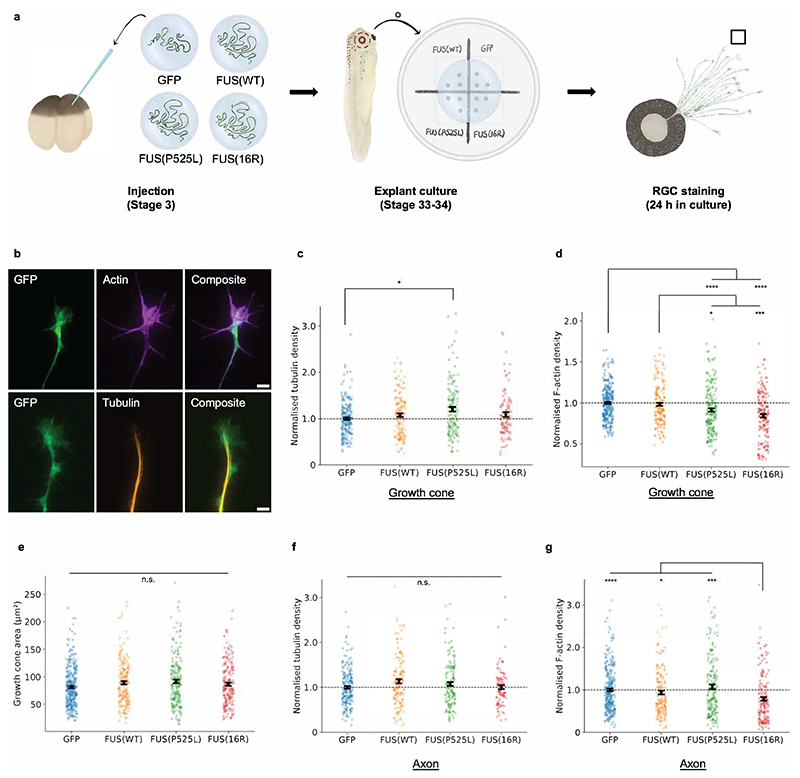
Figure 4. Mutant FUS expression affects growth cone cytoskeletal filament density.
a) Schematic of experimental procedure. Embryos are injected as previously. Eye primordia are cultured at stage 33-34, and RGCs are fixed and stained after overnight outgrowth. Fluorescent signal is then quantified. b) Sample images of growth cones. For quantitative imaging, growth cones are labelled with phalloidin (staining F-actin) or an anti-β-tubulin antibody (staining tubulin) (scale bar: 5 μm). c) FUS(P525L) may increase growth cone normalised microtubule density. (Number of growth cones analysed: nGFP=204; nFUS(WT)=139; nFUS(P525L)=139; nFUS(16R)=96.) d) Mutant FUS reduces normalised F-actin intensity in growth cones. (Number of growth cones analysed: nGFP=309; nFUS(WT)=182; nFUS(P525L)=197; nFUS(16R)=182). e) Growth cone area is not affected by expression of mutant FUS. (Number of growth cones analysed as in Figure 4d). f) Normalised axon shaft tubulin density is not affected by mutant FUS. (Number of axons analysed: nGFP=201; nFUS(WT)=137; nFUS(P525L)=143; nFUS(16R)=99.) g) Normalised axon shaft F-actin density is affected by FUS(16R) but not FUS(P525L). (Number of axons analysed: nGFP=285; nFUS(WT)=171; nFUS(P525L)=188; nFUS(16R)=170.) (c-g): N≥3 replicates for each condition. All conditions were compared pairwise, those that are significantly different are indicated. Kruskal-Wallis tests with Bonferroni correction, error bars indicate standard errors in means.

