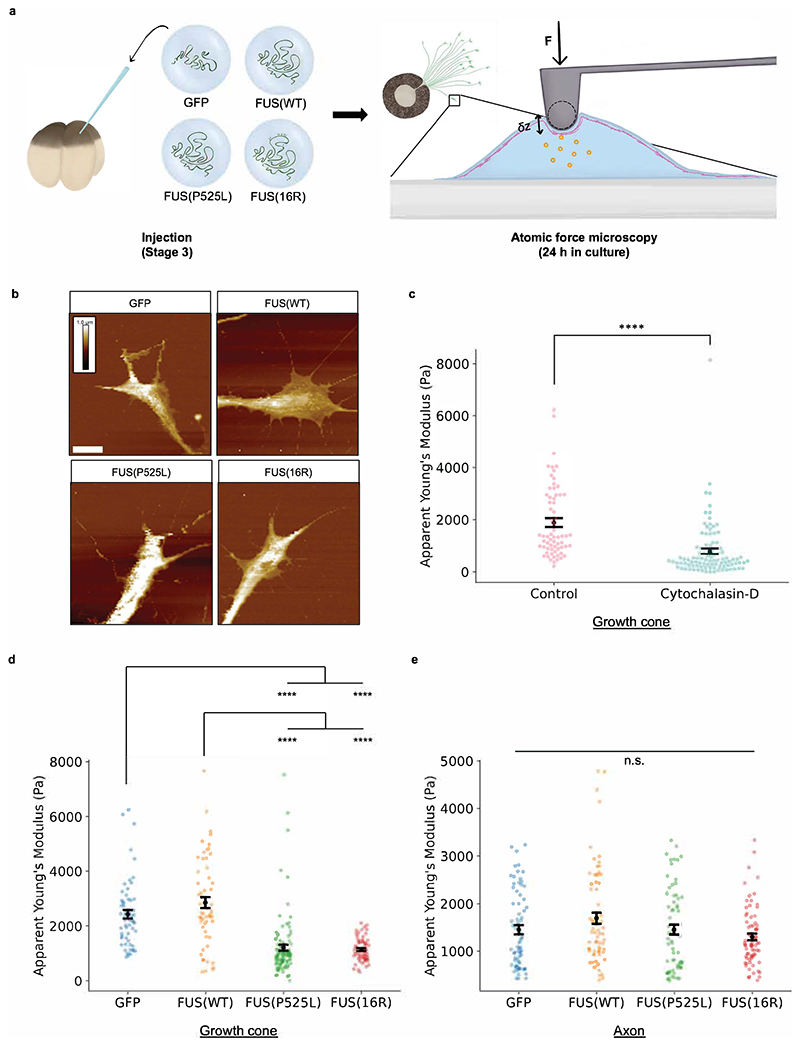
Figure 6. Mutant FUS compromises growth cone mechanoproperties.
a) Schematic of experimental procedure. Embryos are injected and RGCs are cultured as previously (Figure 4a). After outgrowth, force-displacement curves are measured for different parts of individual growth cones b) Sample height maps of growth cones. Scale is the same for all images and shown for GFP-only condition: height is colour-coded, white scale bar (bottom left) is 5 μm. c) Cytochalasin-D treatment lowers the apparent Young’s modulus of growth cones. (Number of force curves analysed: nControl=66; nCytochalasin-D=100.) d) The apparent Young’s modulus of growth cones is reduced by mutant FUS expression. (Number of force curves analysed: nGFP=59 from 5 cells; nFUS(WT)=61 from 5 cells; nFUS(P525L)=104 from 9 cells; nFUS(16R)=64 from 5 cells.) e) The apparent Young’s modulus of axon shafts is not affected by mutant FUS expression. (Number of force curves analysed: nGFP=71 from 5 cells; nFUS(WT)=64 from 5 cells; nFUS(P525L)=69 from 5 cells; nFUS(16R)=75 from 5 cells.) c-e) N≥3 replicates for each condition. All conditions were compared pairwise, those that are significantly different are indicated. Kruskal-Wallis tests with Bonferroni correction, error bars indicate standard errors in means.

