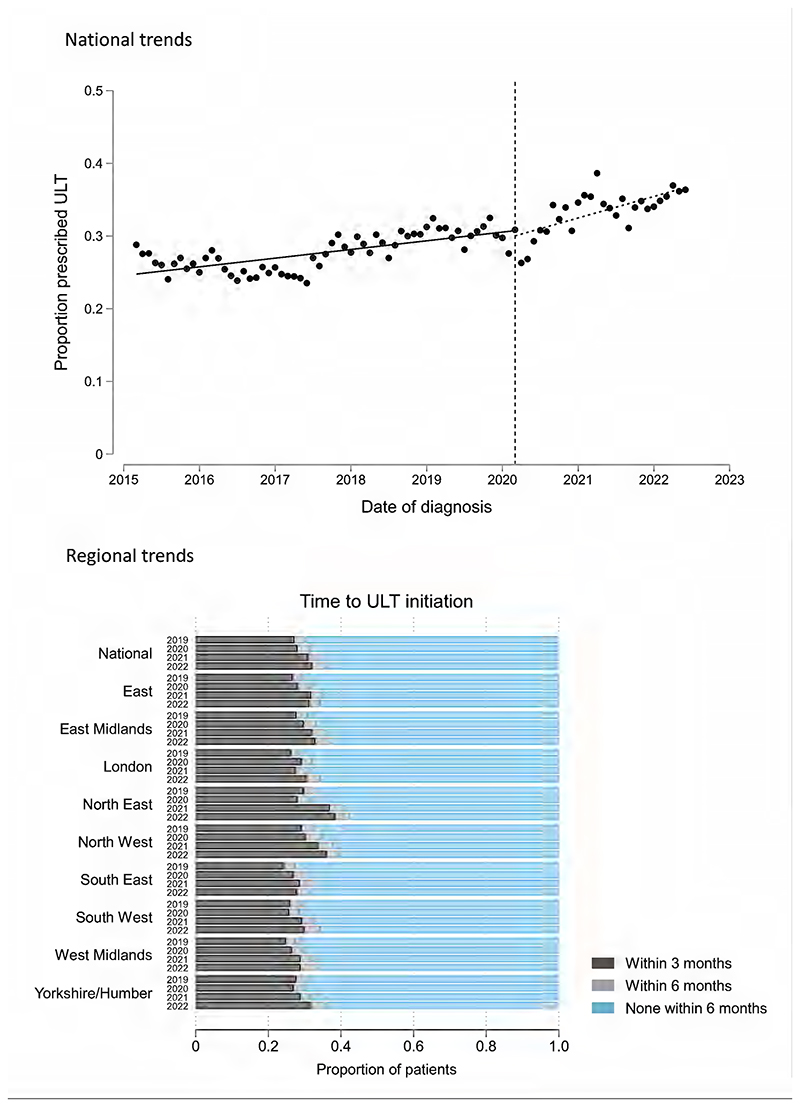
Figure 2.
Trends in the proportion of patients with incident gout who were initiated on ULT. In the top panel, an interrupted time series analysis shows national trends in the mean monthly proportion of patients who initiated ULT within 6 months of diagnosis. The vertical dashed line corresponds to the onset of the first COVID-19 lockdown in England (March 2020). The bottom panel shows the proportion of patients who were prescribed ULT within 3, 6, or >6 months of diagnosis, separated by region of England and by year (March 2019/20; March 2020/21; March 2021/22; March 2022/23).

