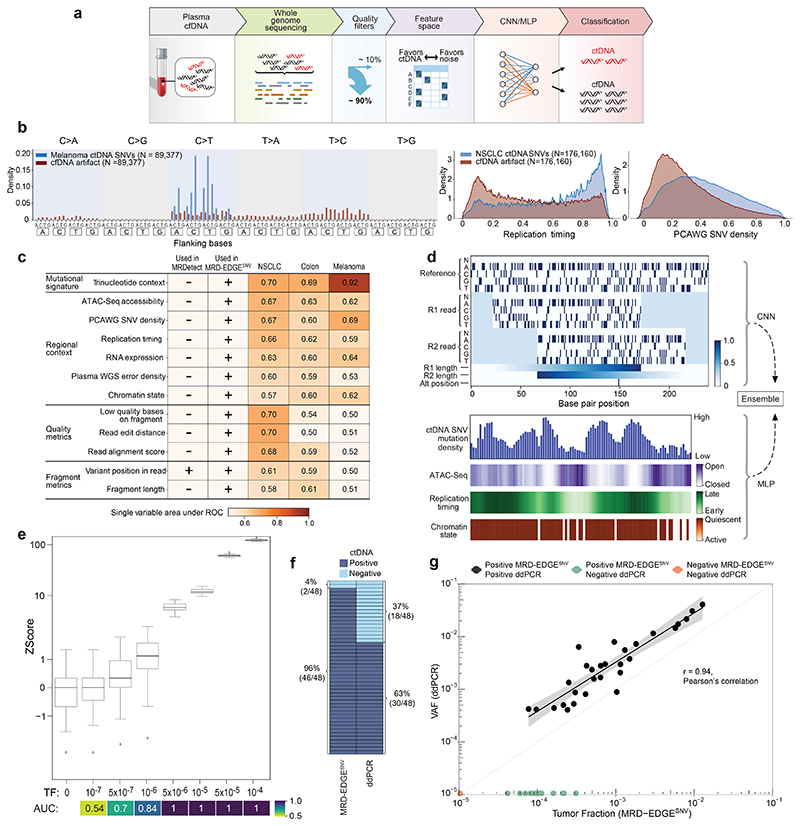
Figure 1. MRD-EDGESNV deep learning classifier distinguishes ctDNA SNV fragments from cfDNA artifacts.
a) MRD-EDGE schematic. b) Selected feature density plots for ctDNA and cfDNA SNV artifacts: trinucleotide context (left), replication timing (middle)25, PCAWG60 (right). c) Heatmap of predictive power of selected features (Methods) measured by single variable area under the receiver operating curve (svAUC, Methods) in NSCLC, CRC, and melanoma. Feature use in MRDetect or MRD-EDGESNV is indicated. d) (top) Illustration of the fragment tensor, an 18x240 matrix encoding of the reference sequence, R1 and R2 read pairs, R1 and R2 read length, and SNV position in the fragment (‘Alt position’). The fragment tensor is passed as input to a convolutional neural network (CNN). (bottom) Relationship between local ctDNA SNV mutation density at the chromosome level and regional features: cancer type-specific chromatin inaccessibility (ATAC-Seq), late replicating regions (Replication timing) and quiescent genomic regions (Chromatin state) are associated with increased density of tumor-confirmed ctDNA SNVs. Regional features (Supplementary Table 2) are encoded as tabular values and passed as input to a multilayer perceptron (MLP). An ensemble classifier takes input from both the fragment and regional models to determine the likelihood that each fragment is ctDNA or cfDNA SNV artifact. e) In silico studies of cfDNA from the metastatic cutaneous melanoma sample MEL-100 mixed into cfDNA from a healthy plasma sample (CTRL-216) at mix fractions TF = 10-7–10-4 at 16X coverage depth, performed in 20 technical replicates with independent sampling seeds. An AUC heatmap demonstrates detection performance at the different admixed TFs vs. negative controls (TF=0) as measured by Z score, with tumor-informed MRD-EDGESNV enabling sensitive detection at TF=5*10-7 (AUC 0.70). Box plots represent median, lower and upper quartiles; whiskers correspond to 1.5 x interquartile range. f) ctDNA detection status of preoperative stage III CRC plasma samples analyzed by MRD-EDGESNV and ddPCR (n = 48). g) Comparison of estimated ctDNA levels estimated by MRD-EDGESNV (TFs) and ddPCR (variant allele frequency, VAF). Estimated TFs/VAFs of ctDNA-negative samples were set to 0. Linear regression includes samples called positive by both ddPCR and MRD-EDGESNV (black dots). Shaded area represents 95% confidence interval.

