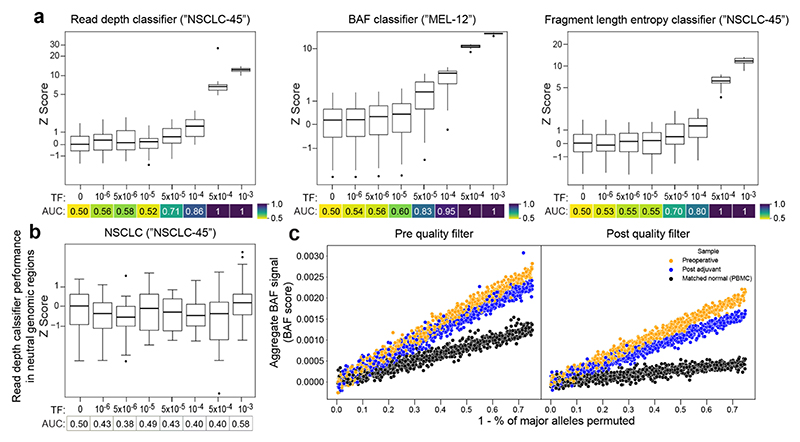
Extended Data Fig. 4. In silico mixing studies of MRD-EDGECNV in CRC, NSCLC, and melanoma.
a,b) In silico mixing studies in which high TF plasma samples were admixed into non-cancer plasma (a) or low TF plasma samples (b). Admixtures model tumor fractions of 10-6–10-3 (see Methods for detailed description of in silico admixture process). Box plots represent median, lower and upper quartiles; whiskers correspond to 1.5 x interquartile range. An AUC heatmap demonstrates detection performance vs. TF=0 at different mixed TFs as measured by a sample Z score (derived from summed read-depth skews for read depth classifier, BAF score for BAF classifier, summed fragment length entropy for fragment length entropy classifier, Methods) compared to TF=0 distribution for each replicate. a) Pretreatment NSCLC plasma from the patient NSCLC-45 was mixed into non-cancer control plasma from the patient CTRL-206 in 25 technical replicates (each subsampling seed represents a technical replicate). The read depth (left) and fragment length entropy (right) classifiers demonstrate similar performance in pretreatment NSCLC admixtures compared to CRC admixtures (Fig. 2b-d). (middle) Pretreatment melanoma plasma from the patient MEL-12 was mixed into posttreatment plasma following a major response to immunotherapy in 25 technical replicates. The BAF classifier demonstrates similar performance compared to CRC admixtures (Fig. 2c) and accounts for bias that may be encountered when mixing plasma into matched peripheral blood mononuclear cell (PBMC) normal, as performed in CRC. b) Z scores for the read depth classifier in neutral regions (no copy number gain or loss in the matched tumor WGS data) for NSCLC demonstrates the expected absence of directional read depth skew in copy neutral regions. c) Assessment of preoperative plasma, post adjuvant plasma, and matched normal (from PBMCs) BAF in SNPs before (left) and after (right) SNP quality filters in CRC (patient CRC-465). Filters include mapping bias correction and outlier exclusion criteria (Methods). BAF signal is calculated through least squares linear regression on SNPs from LOH regions identified in matched tumor WGS, accounting for underlying copy number state in tumors (Methods). To demonstrate the relationship between signal and phased SNPs, the major allele in plasma is randomly permuted to be in phase or out of phase at the percentage specified along the x axis. Following quality filtering, signal can be appropriately inferred and demonstrates the expected relationship between preoperative plasma (highest signal), postoperative MRD (intermediate signal), and PBMC BAF (minimal signal).

