
Extended Data Fig. 7: MRD-EDGE detection of ctDNA from colorectal pT1 carcinomas and adenomas.
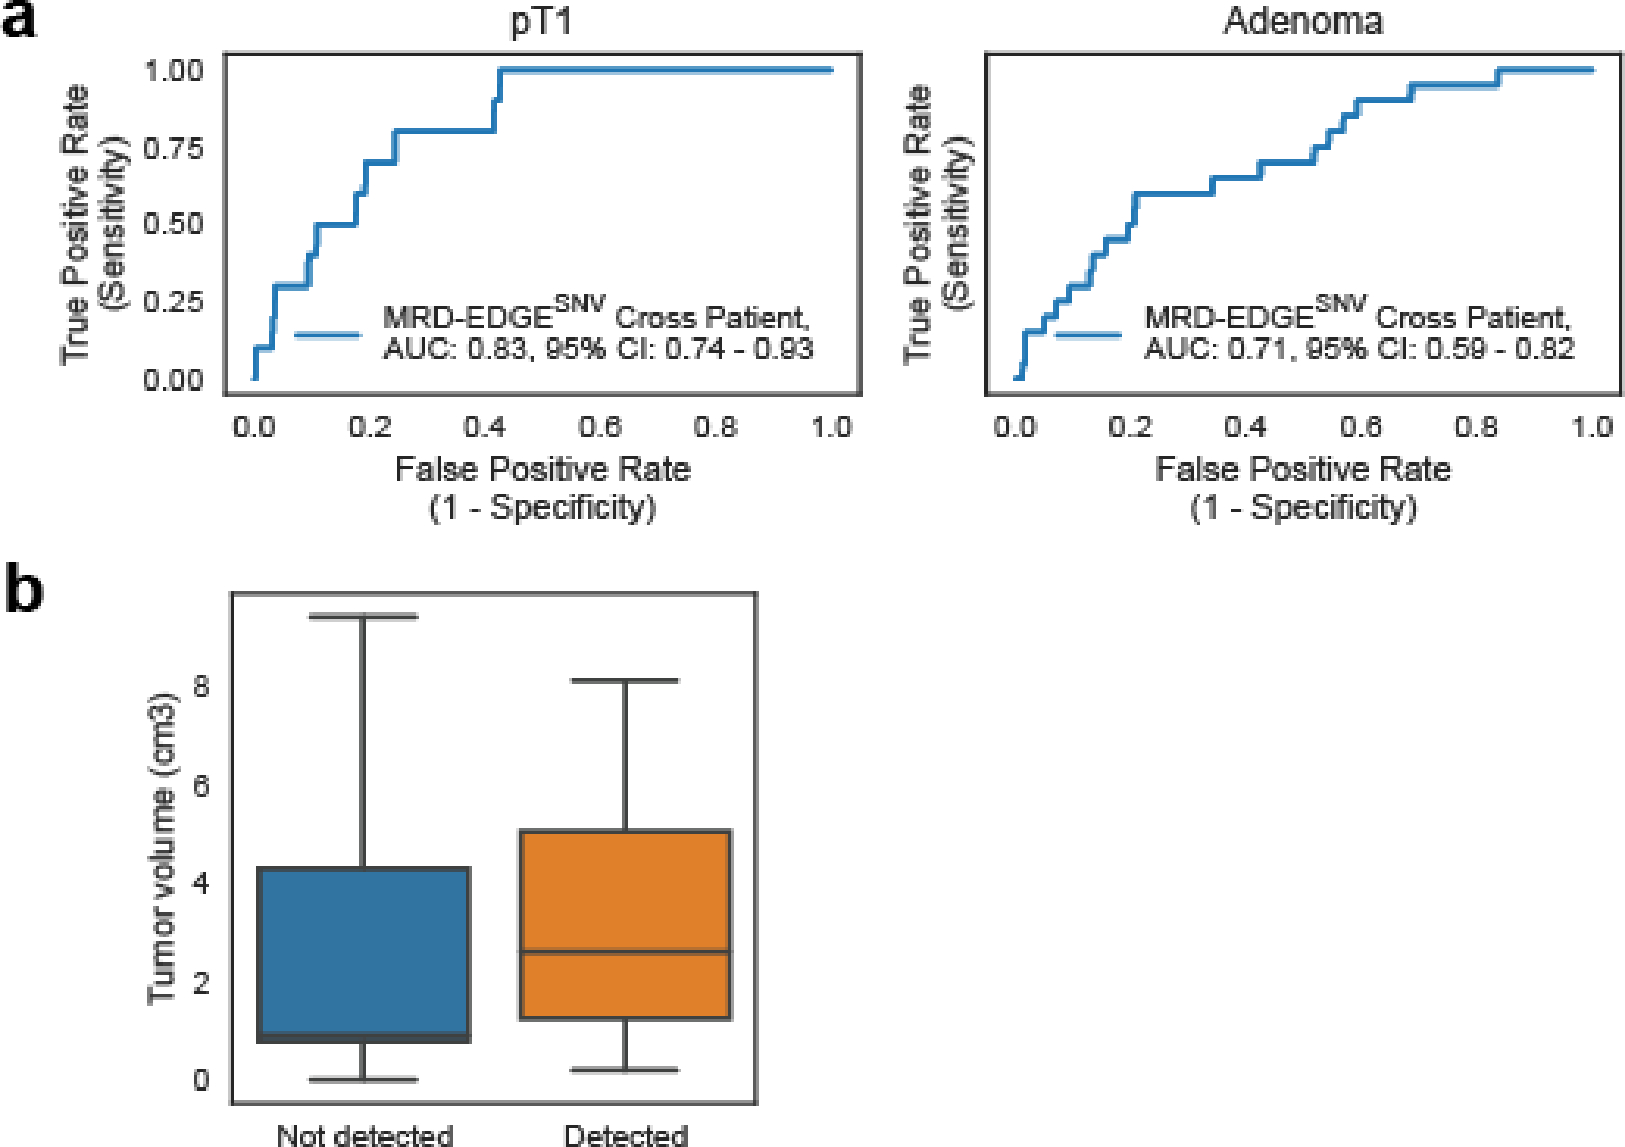
a) Cross-patient ROC analysis for MRD-EDGESNV in screen-detected pT1 lesions (left) and adenomas (right). Preoperative plasma samples with matched tumor mutation profiles are compared with a cross-patient panel of plasma samples assessed against all unmatched cross-patient tumor profiles (n=44, including 29 pT1 and adenoma cross patients and 15 stage III preoperative patients). b) Tumor resection volume for adenoma samples in which ctDNA was detected (orange) and non-detected (blue). Box plots represent median, bottom and upper quartiles; whiskers correspond to 1.5 x interquartile range.