
Extended Data Fig. 8: Use of MRD-EDGESNV in acral melanoma and monitoring response to immunotherapy with MRD-EDGESNV.
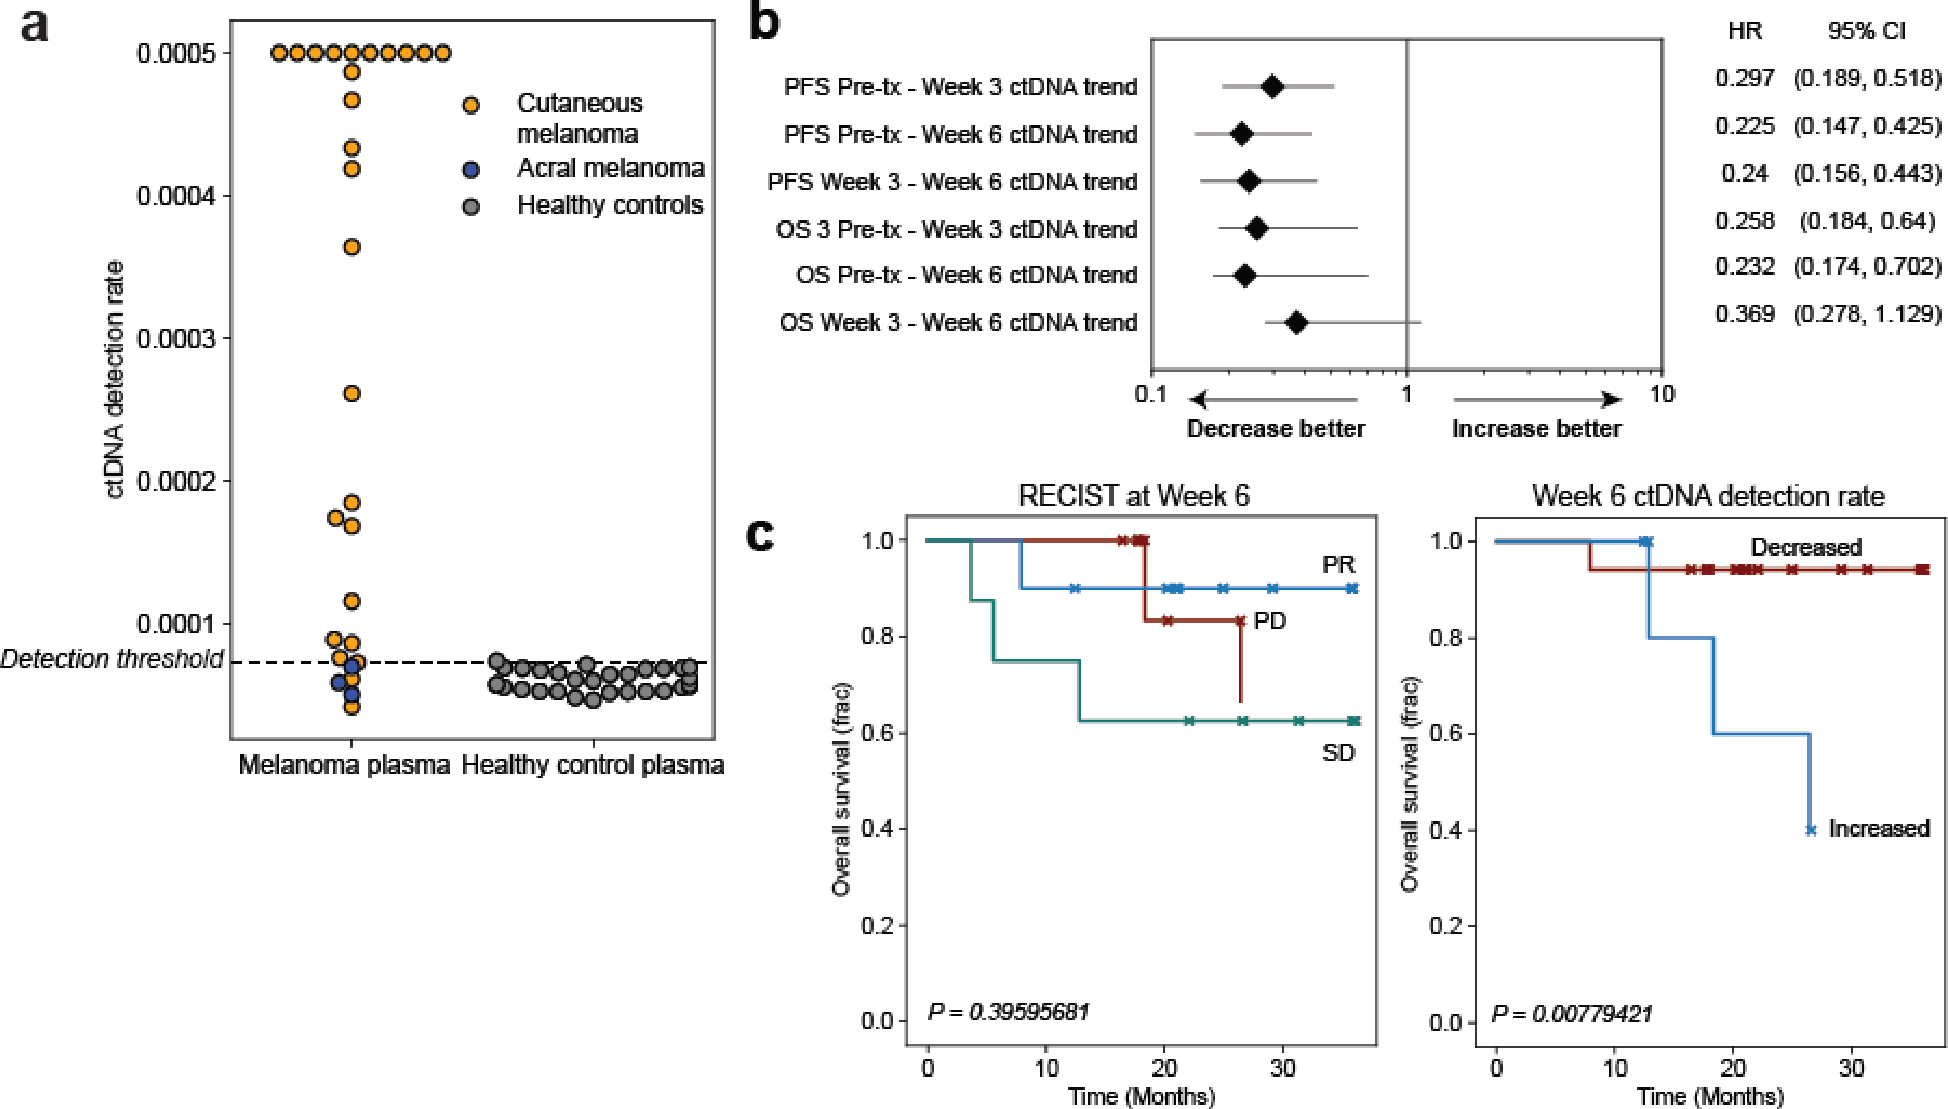
a) ctDNA detection rates for pretreatment cutaneous melanoma samples from the adaptive dosing cohort (n=26, orange, detection rate was capped at 0.0005) compared to acral melanoma samples (n=3, blue, pre- and posttreatment timepoints from one patient with acral melanoma) sequenced within the same batch and flow cell and detection rates as healthy control plasma (n=30, gray). ctDNA is not detected from acral melanoma plasma, demonstrating absence of batch effect and the specificity of MRD-EDGESNV for the UV signatures associated specifically with cutaneous melanoma. b) Forest plot demonstrating relationship between ctDNA TF trend (increase or decrease) and progression-free survival (PFS) and overall survival (OS) at serial posttreatment timepoints. MRD-EDGESNV TF estimates are measured as a detection rate normalized to the pretreatment sample (normalized detection rate, nDR). Each posttreatment timepoint is prognostic of PFS outcomes. HR, hazard ratio. c) (left) Kaplan–Meier overall survival analysis for Week 6 RECIST response (n=10 partial response, ‘PR’, n=8 stable disease, ‘SD’, n=6 progressive disease, ‘PD’) in the adaptive dosing melanoma cohort (n=26 patients) where CT imaging was available at Week 6 shows no significant relationship with OS (multivariate logrank test). (right) Kaplan–Meier OS analysis for Week 6 ctDNA trend in adaptive dosing melanoma patients with decreased (n=17) or increased (n=5) nDR compared to pretreatment timepoint as measured by MRD-EDGESNV. Patients with undetectable pretreatment ctDNA (n=2) were excluded from the analysis, as were 2 patients where Week 6 plasma was not available for analysis. Increased nDR at Week 6 was associated with shorter overall survival (two-sided log-rank test).