
Extended Data Fig. 9: Use of MRD-EDGESNV to monitor response to ICI in small cell lung cancer.
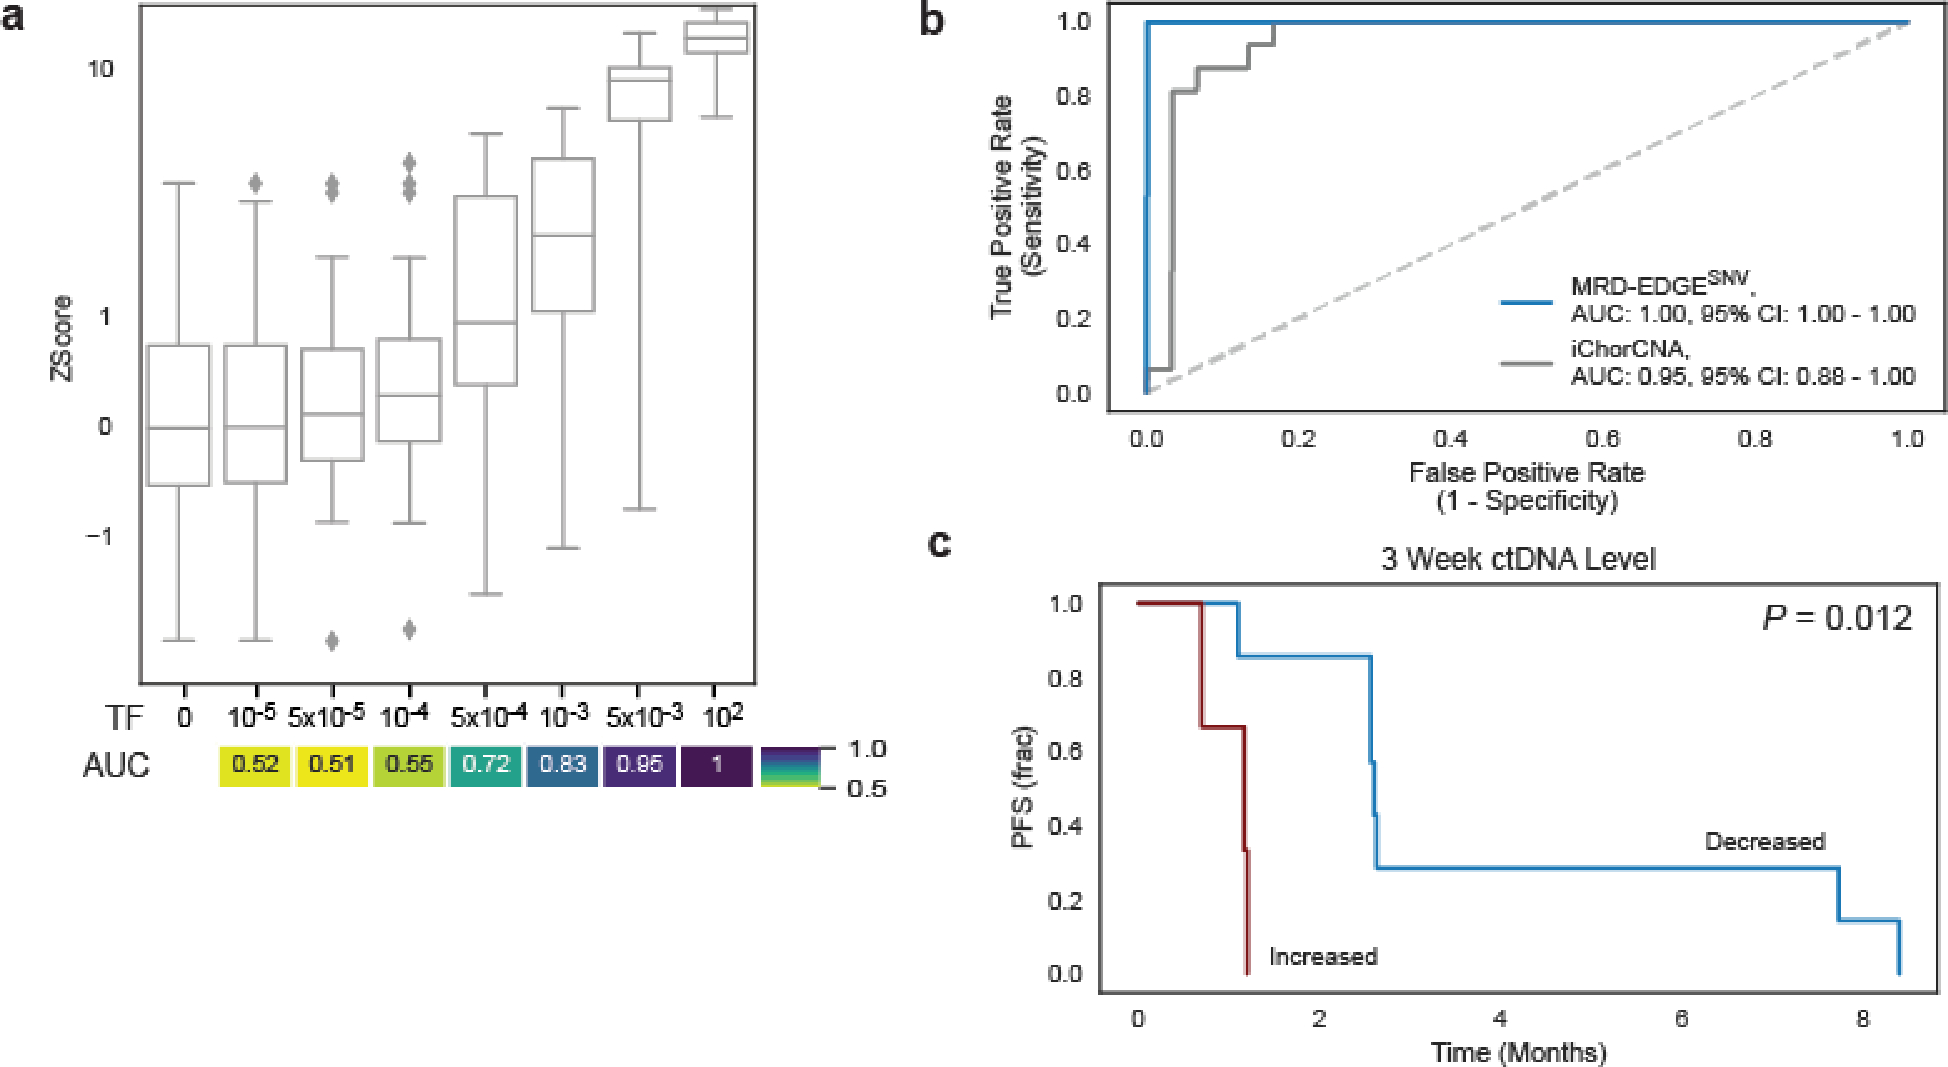
a) In silico studies of cfDNA from the SCLC sample SC-128 (pretreatment TF = 22.9%) mixed in n=20 replicates against cfDNA from a healthy plasma sample (TF=0) at mix fractions 10−5–10−2 at 25X coverage depth. MRD-EDGESNV enables sensitive detection of TF as low as TF=5*10−4 (AUC 0.72), measured by Z score of SNV fragment detection rate against unmixed control plasma (TF=0, n=20 randomly chosen replicates), without matched tumor tissue to guide SNV identification. Box plots represent median, bottom and upper quartiles; whiskers correspond to 1.5 x interquartile range. An AUC heatmap measures detection vs. TF=0 at different mixed TFs. B) ROC analysis on detection rates for MRD-EDGESNV (blue) and TF estimation with ichorCNA (gray) in pretreatment SCLC plasma samples (Supplementary Table 7). Fragment detection rates in SCLC plasma samples (n=16 plasma samples, Supplementary Table 5) were compared with fragment detection rates in control plasma samples (n=30). C) Kaplan–Meier progression-free survival analysis for Week 3 ctDNA trend in SCLC patients with decreased (n=7) or increased (n=3) normalized detection rate (nDR) as measured by MRD-EDGESNV. Increased nDR at Week 3 was associated with shorter progression-free survival (two-sided log-rank test).