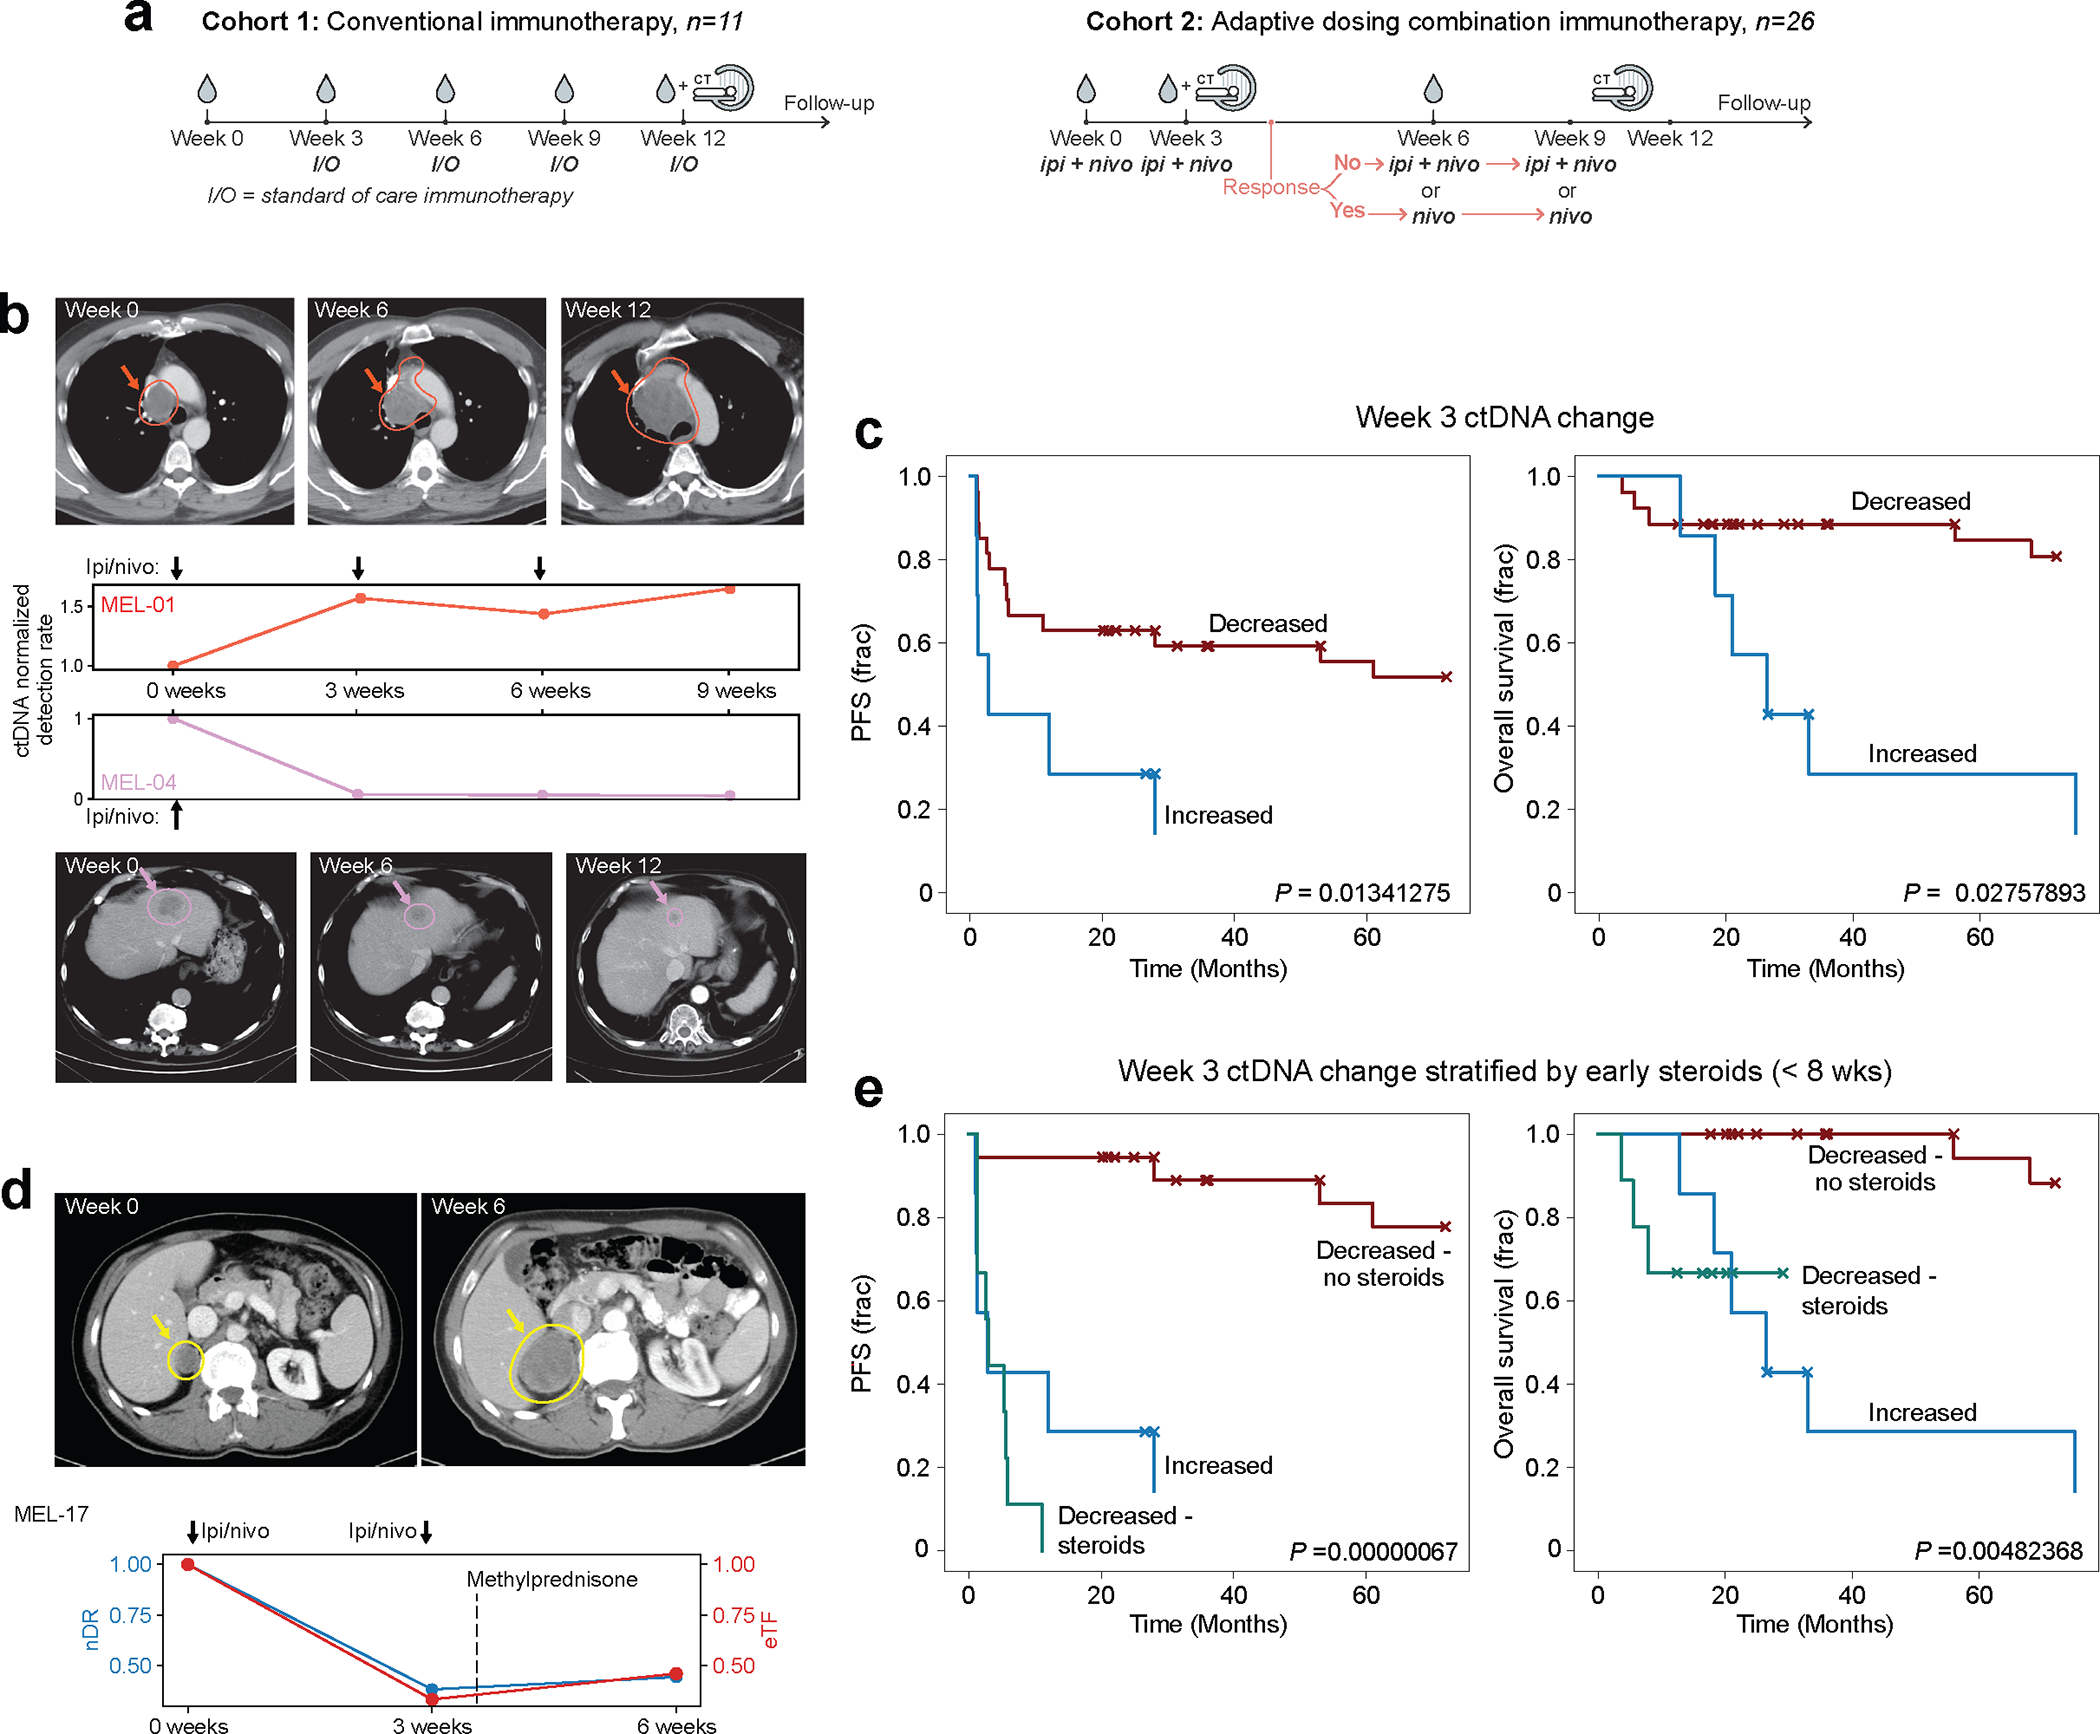
Figure 6: Serial monitoring of clinical response to immunotherapy with MRD-EDGESNV.

a) Two advanced melanoma cohorts. (left) conventional immunotherapy cohort received nivolumab monotherapy or combination ICI. Plasma was collected at pretreatment timepoint and weeks 3, 6, and 12. Cross sectional imaging to evaluate response to treatment was performed at 12 weeks. (right) adaptive dosing cohort received combination immunotherapy as in Fig. 5c. b) Serial plasma TF monitoring with MRD-EDGESNV corresponds to changes seen on imaging. TF estimates are measured as normalized detection rate (nDR) to the pretreatment sample for MRD-EDGESNV. (top) ctDNA nDR increases over time in a patient with disease refractory to ICI. The patient had progressive disease at Week 6 and Week 12 CT assessment. (bottom) ctDNA nDR decreased at Week 3 in a patient with a partial response to therapy. CT imaging demonstrates tumor shrinkage at Week 6 and Week 12. c) Kaplan–Meier progression-free (left) and overall (right) survival analysis for Week 3 ctDNA trend in patients with decreased (n=27) or increased (n=7) nDR, measured by MRD-EDGESNV. Patients with undetectable pretreatment ctDNA (n=3) were excluded. Increased nDR at Week 3 was associated with shorter progression-free and overall survival (two-sided log-rank test). d) (top left) pretreatment CT imaging of a patient with decreased ctDNA in response to ICI at Week 3 on both MRD-EDGESNV (nDR, blue) and a tumor-informed panel (normalized variant allele frequency, nVAF, red). Following the administration of methylprednisone at Week 3, estimated TF (eTF) on both ctDNA detection platforms increased. At Week 6, progressive disease is seen on CT imaging (top right). e) Early steroids for immune-related adverse events (irAEs) within the combination ICI dosing period (prior to Week 8) further stratify Week 3 survival analyses. Kaplan–Meier progression-free survival (left) and overall survival (right) analysis for patients with primary refractory disease (‘Increased’, blue, n=7), defined as rising nDR seen at Week 3 following first dose of treatment, decreasing ctDNA who did not receive steroids (‘Decreased - no steroids’, red, n=18), and patients who received steroids for irAEs within the combination ICI dosing period (‘Decreased - steroids’, green, n=9). P value reflects multivariate logrank test.
