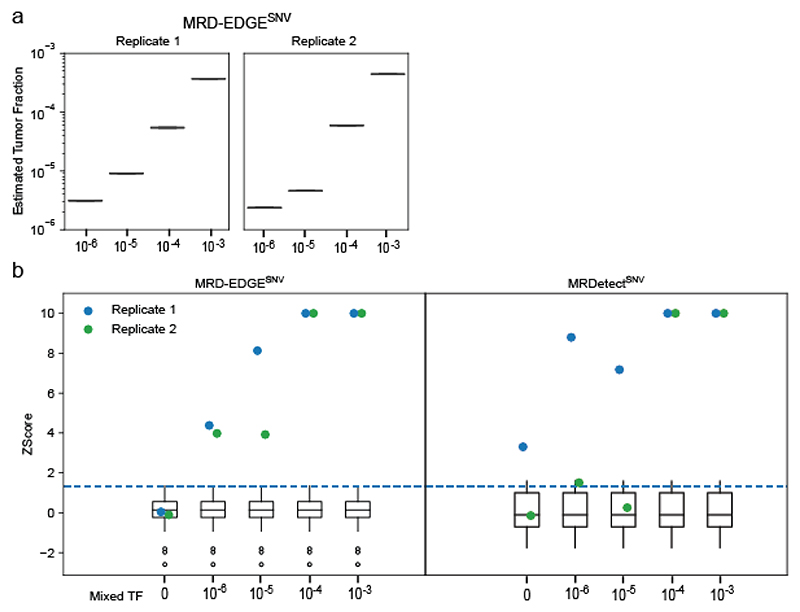
Extended Data Fig. 3. Estimated tumor fractions in experimental mixing studies with MRD-EDGESNV.
a) Plasma TF inference with MRD-EDGESNV using genome-wide SNV integration for in vitro dilutions of the pretreatment melanoma plasma MEL-137_A in expired plasma harvested through plasmapheresis from a donor without known cancer. Dilutions were performed in 2 replicates, and a mean noise rate for the patient-specific mutation profile was drawn from n=17 concurrently sequenced SCLC plasma samples (Supplementary Table 5). b) MRD-EDGESNV (left) and MRDetectSNV (right) Z score discrimination between ctDNA detected in experimental plasma replicates (blue dots, replicate 1, and green dots, replicate 2) from the patient MEL-137 and downsampled TF=0 replicates (white boxes, n=30, 15 downsampled alignment files from 2 TF=0 replicates). Signal is measured from SNV detection rates on patient plasma and the downsampled TF=0 plasma samples using the patient-specific SNV profile for MEL-137. Positive ctDNA detection (dotted blue line) was defined as patient plasma MRD-EDGESNV or MRDetectSNV Z score above a detection threshold of 95% specificity against downsampled TF=0 plasma in the ROC for each platform (Supplementary Table 4). Sample-level Z scores were capped at 10 to allow greater visibility of Z scores around the detection threshold.

