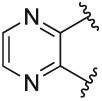
Table 3. Pharmacological evaluation analogues 12a-20 tested at 10 μM against an ACh-mediated concentration-response curve.

| ||||
|---|---|---|---|---|
| Compound # | A | Δbaselinea | ΔpEC50 | ΔEmaxb |
| 1e |
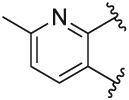
|
103.2 ± 2.85 | 1.48 ± 0.20 | 44.7 ± 2.74 |
| 12a |
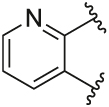
|
13.0 ± 2.18* | 0.88 ± 0.07* | 41.6 ± 2.67 |
| 12b |

|
6.49 ± 1.85* | 0.63 ± 0.07* | 25.6 ± 2.78* |
| 12c |
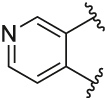
|
47.2 ± 2.93* | 0.17 ± 0.13* | 56.8 ± 4.81 |
| 12d |
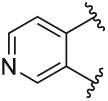
|
90.6 ± 7.00* | 1.49 ± 0.28 | 66.6 ± 5.99* |
| 12e |
|
48.5 ± 2.91* | −0.34 ± 0.16* | 35.1 ± 5.31 |
| 16 | 20.0 ± 4.81* | 1.07 ± 0.20 | 11.8 ± 6.21* | |
| 20 | 24.5 ± 2.44* | 1.06 ± 0.10 | 13.9 ± 2.95* | |
Data represent the mean ± SEM of 4 independent experiments performed in duplicate. Only the change in pEC50, baseline and Emax for the 10 μM concentrations of PAMs are reported, with the full ACh concentration-response curves in the presence of 10 μM PAMs shown in Supp. Fig. 4. Data were analysed by one-way ANOVA and compared to the control PAM, 1e, with a post-hoc Dunnett test,
where *p < 0.05 was considered to be significantly different.
Δbaseline is expressed as a percentage of the baseline ACh response in the absence of PAM.
ΔEmax is expressed as a percentage of the maximum ACh response in the absence of PAM.
