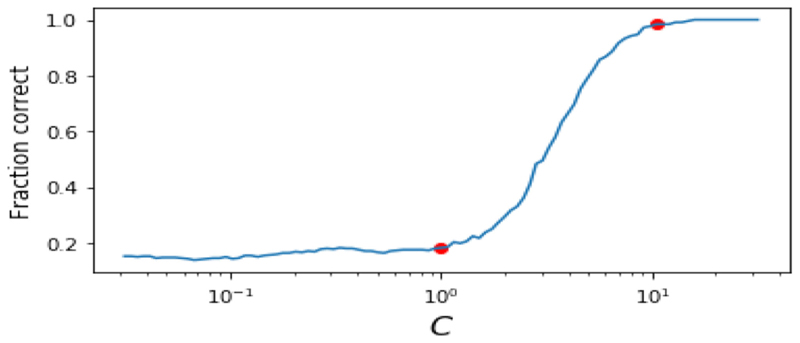
Fig. 4. The fraction of nearest neighbours correctly predicted by the results of the MA plotted against the weighting applied to the noiseless dataset.
As the weighting C increases the fraction of correct predictions goes to 1. Note that the unweighted case, C = 1, highlighted by the red marker performs significantly worse than the strongly weighted case highlighted at C =10.

