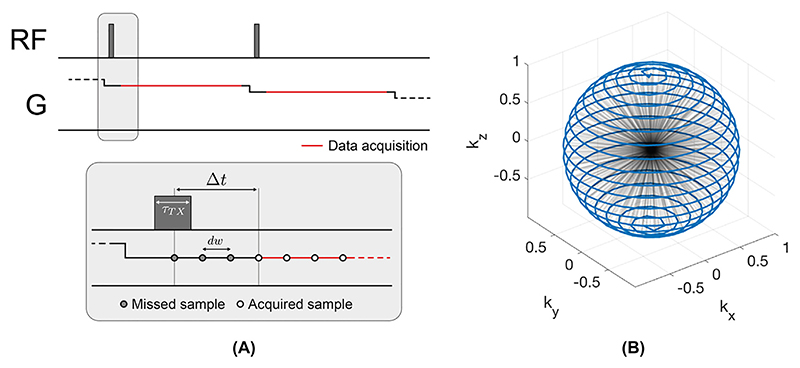
Fig. 2.
(A) Simplified ZTE pulse sequence diagram with two spokes, showing RF excitation and the gradient waveform on one axis together with magnification of the RF excitation part of the spoke, showing the dead-time gap Δt after RF excitation. (B) 3D view of spoke distribution in k-space with the endpoints of each spoke connected by the blue line.

