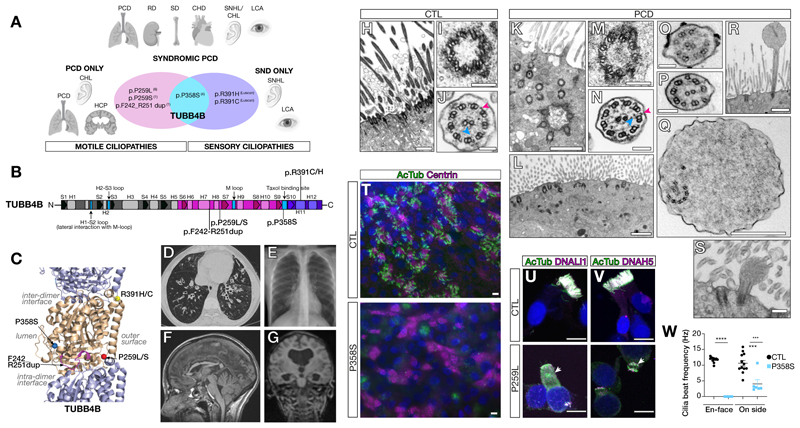
Figure 1. Distinct de novo TUBB4B variants caused PCD-only, SND-only or syndromic (PCD+SND) disease.
(A) Schematic of patient phenotypes within the ciliopathic spectrum clustered on genotypes. Abbreviations: CHL: conductive hearing loss; CHD: congenital heart disease; HCP: hydrocephaly; LCA: Leber congenital amaurosis; PCD: primary ciliary dyskinesia; RD: renal disease; SD: skeletal defects; SNHL: sensorineural hearing loss; SND: sensory-neural disorder.
(B,C) Resulting changes mapped onto a protein schematic (B) or an atomic model of TUBB4B (gold) with TUBA1 (purple) (C).
(D-G) Clinical features of PCD patients: (D) chest CT showing bilateral lower lobe bronchiectasis (P1); (E) X-ray showing right middle lobe atelectasis (P2); (F) midline T1 sagittal image showing irregular corpus callosum secondary to earlier hydrocephaly (shunted), no evidence of basal ganglia dysmorphology is observed, typical of tubulinopathies (P1); (G) MRI showing dilated ventricles (P8).
(H-S) TEM of healthy donor (H-J) and PCD patient nasal epithelia (K-S). Patient samples showed misoriented, internally docked (K) or reduced centrioles without axonemes (L) (P3), incomplete microtubule triplets (P3) (M), and rare intact axoneme (P9) with both inner (blue arrowheads) and outer (magenta arrowheads) dynein arms (N). Missing doublets (O, P3), singlet microtubules (P, P3), disrupted axonemes (Q, P3) or rare short axonemes with bulbous tips (R, P3; S, P10) were observed.
(T) Wholemount immunofluorescence of nasal epithelial cultures from unaffected parent and patient (P9).
(U,V) Immunofluorescence of healthy donor or patient (P2) cells for cilia axonemes and dynein motor proteins. See Fig. S2L,M.
(W) Cilia beat frequency of control and patient (P9) airway cultures. Mean ± SEM from N=3 experimental replicates. Student’s t-test: ***, p ≤ 0.001; ****, p ≤ 0.0001.
Scale bars: 10 μm (T-V); 1 μm (H,K,L,R); 500 nm (Q); 125 nm (I,M), 200 nm (S) and 100 nm (J,N-P).

