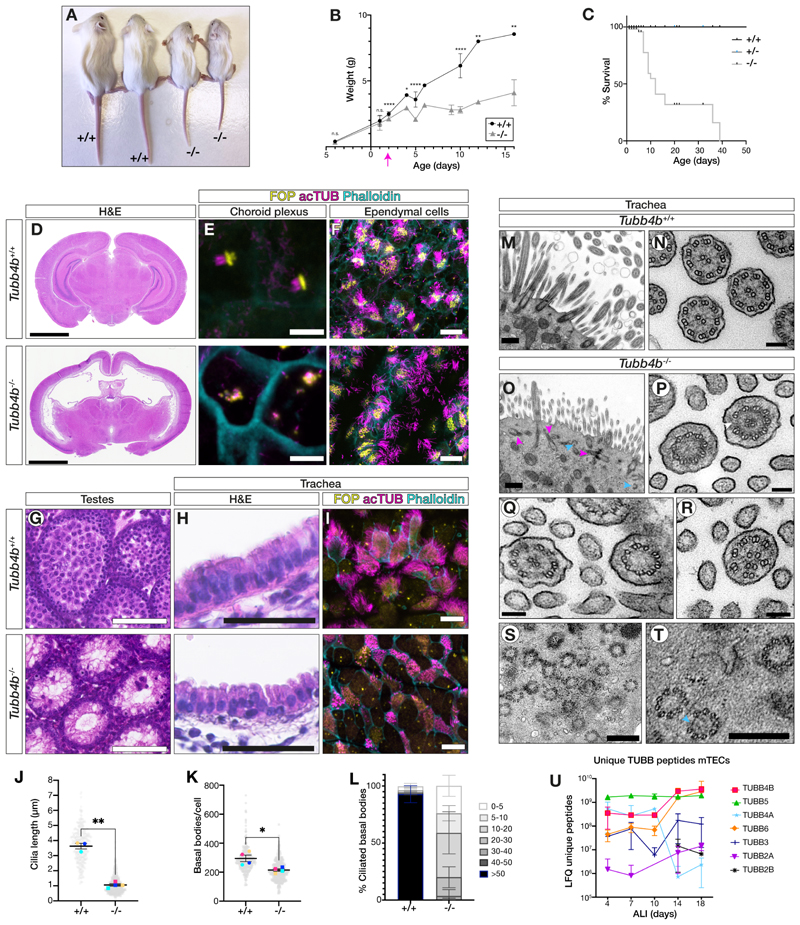
Figure 2. Tubb4b was specifically required for axoneme formation in motile ciliated tissues in vivo.
(A-C) Tubb4b-/- animals exhibited postnatal runting (A, P16), starting from P2 (B), and postnatal lethality (C).
(D-F) Tubb4b-/- animals displayed hydrocephaly (D, P15). Choroid plexus multicilia were disrupted (E, P5) while ependymal cilia were largely normal (F, P5).
(G-I) Tubb4b-/- animals exhibited male infertility and spermatogenesis defects (G, P22) and severe disruption of tracheal cilia by histology (H) and immunofluorescence (I).
(J-L) Quantification of wholemount immunofluorescence of Tubb4b;Centrin2-eGFP neonatal (P5-P8) trachea cilia length (J), basal body number per cell (K) and percentage of ciliated basal bodies per cell (L). See Fig. S3G. N = 4 animals per genotype with (J) n >75 cilia per biological replicate and (K,L) n > 56 cells per biological replicate.
(M-T) TEM from control (M,N) and Tubb4b-/- neonatal (P1-P4) mutant tracheas (O-T). Mutants showed non-docked centrioles without axonemes (magenta arrowheads) and partial centrioles (cyan arrowheads) (O). Missing microtubule doublets (P) (white arrowhead), missing central pair apparatus (R) and microtubule singlets with disrupted organization (Q). Within the mutant cytosol, partial centrioles and centrioles with microtubule doublets instead of triplets (S,T).
(U) Mass spectrometry of differentiating control mTECs detected many unique β-tubulins. Scale bars: 2.5 mm (D), 5 μm (E), 20 μm (F), 100 μm (G), 50 μm (H), 10 μm (I), 500 nm (M,O), 100 nm (N,P,Q,R) and 300 nm (S,T). (B,J,K) Graphic bars: mean ± SEM derived from N>3 animals per time point. Student’s t-test ns, not significant; *, p ≤ 0.1; **, p ≤ 0.01; ***, p ≤ 0.001; ****, p ≤ 0.0001. (U) Line chart: mean ± SEM derived from N=3 experimental replicates per time point.

