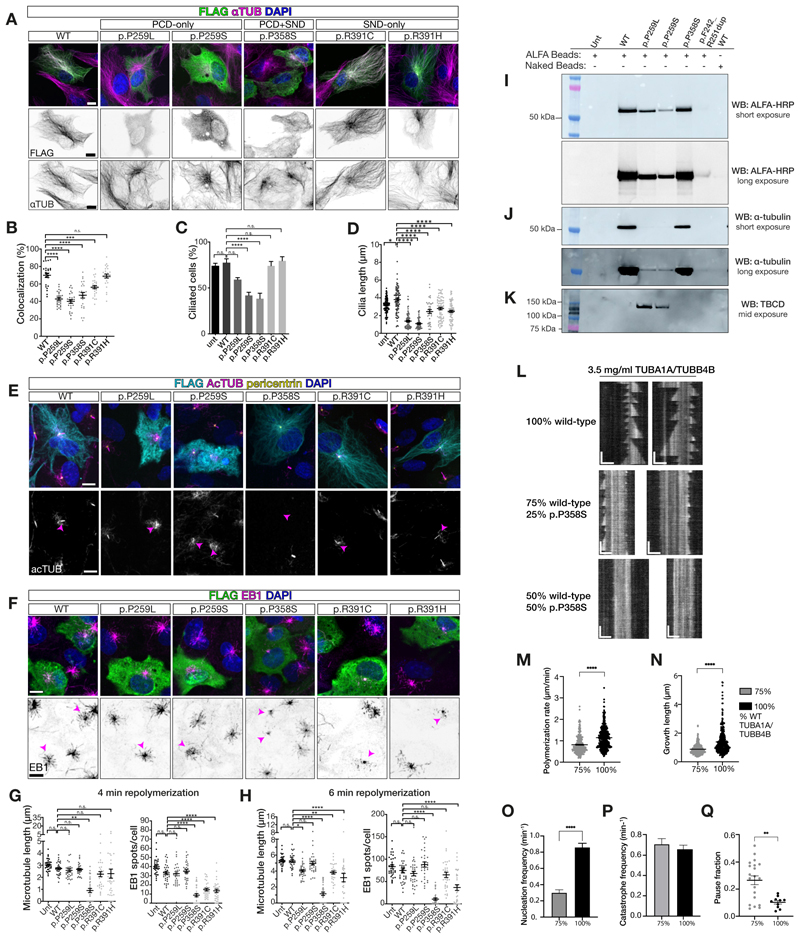
Figure 3. Disease-causing TUBB4B variants altered microtubule dynamics and ciliation.
(A) Microtubule incorporation of wild-type (WT), p.P259L, p.P259S, p.P358S, p.R391C and p.R391H TUBB4B variants overexpressed in RPE1 cells.
(B) Quantification of percentage colocalization of FLAG TUBB4B variants and α-tubulin staining.
(C-E) Ciliogenesis in 24 h serum-starved RPE1 cells overexpressing TUBB4B variants. Acetylated α-tubulin only channel (lower panel) with transfected cell cilia highlighted by magenta arrowhead. Quantification of (D) rates of ciliation and (E) cilia lengths.
(F) Microtubule dynamics analysis of RPE1 cells overexpressing TUBB4B variants, upon repolymerization at 37 °C for 4 min. Inverted EB1 only channel (lower panel) in transfected cell highlighted by magenta arrowhead to illustrate variant effects on dynamics.
(G,H) Quantification upon repolymerization at 4 (G) and 6 (H) min. See also Fig. S6.
(I-K) Affinity purified (ALFA beads) lysates from stable IMCD3 cells expressing ALFA-tagged human TUBB4B variants immunoblotted against ALFA (I), α-tubulin to examine heterodimer assembly (J) and TBCD, a heterodimer assembly pathway chaperone (K).
(L) TIRF microscopy time-lapse image kymographs microtubule growth dynamics from GMPCPP-stabilized wild-type seeds with varying concentrations of p.P358S containing purified tubulin TUBA1-TUBB4B heterodimers (Horizontal scale bar = 3 μm, vertical scale bar = 2.27 min).
(M-Q) Data distribution and statistical analysis of microtubule-polymerization rate (M), growth length (N), nucleation frequency (O), and fraction of time for each microtubule that paused during polymerization (Q) with addition of p.P358S. Catastrophe frequency (P) is not affected. Kinetic analysis was not performed for the 50:50 as no dynamics were observed. See also Fig. S8.
Scale bars: (A, E, F) 10 µm. Plots represent the mean ± SEM, N= 2 (B-D,G,H) or 3 (M-Q) experimental replicates. Ns, not significant; *, p ≤ 0.1; **, p ≤ 0.01; ***, p ≤ 0.001; ****, p ≤ 0.0001.

