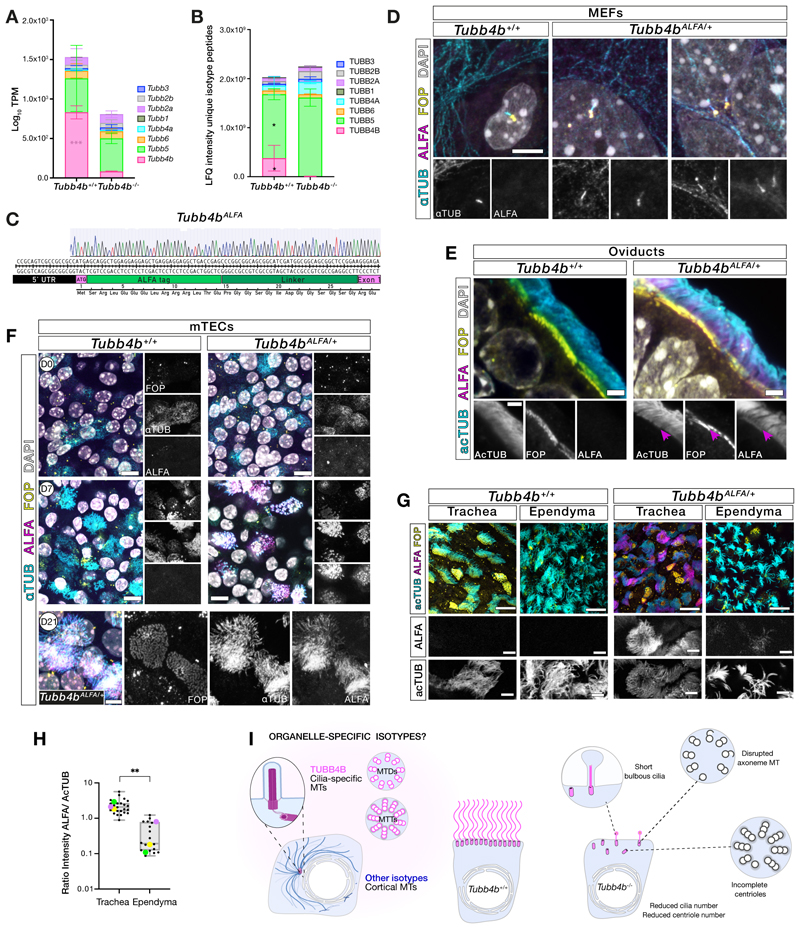
Figure 6. TUBB4B was a centriole and cilia-specific isotype.
(A) Transcriptomic data from neonatal Tubb4b tracheas of β-tubulin isotype mRNA expression profile.
(B) Total proteomic quantitation of β-tubulin isotype unique LFQ peptides from neonatal Tubb4b tracheas.
(C) Schematic of ALFA-tagging of endogenous Tubb4b locus to generate Tubb4bALFA mice.
(D) Immunofluorescence of serum-starved primary Tubb4b+/+ and Tubb4bALFA/+ MEFs stained for centrioles (FOP, yellow), TUBB4B (ALFA, magenta) and pan-α tubulin (αTUB, cyan).
(E) Immunofluorescence of P57 Tubb4b+/+ and Tubb4bALFA/+ oviduct sections stained for centrioles (FOP, yellow), TUBB4B (ALFA, magenta) and acetylated-α tubulin (AcTUB, cyan). Centriolar TUBB4B staining (magenta arrow).
(F) Wholemount immunofluorescence of Tubb4b+/+ and Tubb4bALFA/+ mTEC cultures stained for centrioles (FOP, yellow), TUBB4B (ALFA, magenta) and pan-α tubulin (αTUB, cyan), at day 0 (D0), 7 (D7) or 21 (D21) post-airlift.
(G,H) Comparative quantitation of endogenous TUBB4B in cilia by wholemount immunofluorescence of P8 Tubb4b+/+ (N= 2) and Tubb4bALFA/+ (N=3) matched trachea and ependyma stained for centrioles (FOP, yellow), TUBB4B (ALFA, magenta) and acetylated-α tubulin (AcTUB, cyan), acquired with identical setting.
(H) Relative intensity ratio of ALFA:AcTUB in cilia with mean from each animal (color matched). This revealed significantly higher levels of TUBB4B in tracheal cilia, supporting ependymal cilia contained alternate isotypes.
(I) Summary model for a cilia- and centriole-specific role for TUBB4B.
Scale bars: 5 μm (D), 2 μm (E), 10 μm (F,G merged), and 5 μm (F lower row, G single channel). (A, B) Stacked graphs: mean ± SD from N=3-5 biological replicates. (H) Box and whisker plot: median ± upper and lower extremes of all samples, where colored dots represent mean of each biological replicate from N=3, n=17-23 cells. Student’s t-test: *, p ≤ 0.05; **, p ≤ 0.01; ***, p ≤ 0.005.

