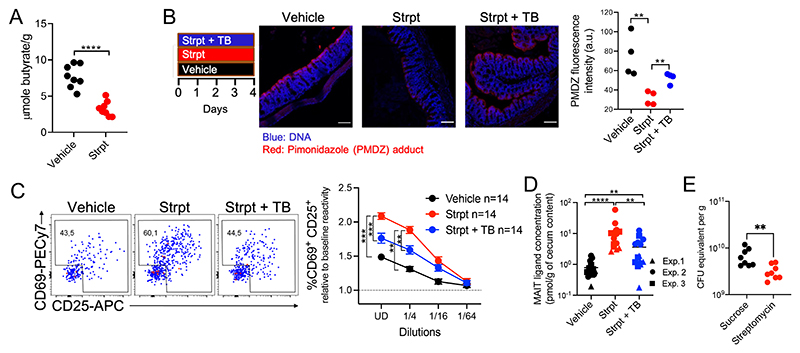
Fig. 2. Dysanaerobiosis drives microbiota production of MAIT ligands.
(A) cecal butyrate concentrations in control (vehicle) and streptomycin (strpt)–treated mice. n = 8 mice per group, N = 1. ****P < 0.0001 by unpaired Student’s t test. (B) left, PMDZ adduct (red) and DaPi (blue) staining at colon epithelial surfaces (each dot summarizes data from one mouse). White bars represent 100 μm. Representative of N = 2. **P < 0.01 by unpaired Student’s t test. (C) MR1:5-OP-RU–specific TCR Tg T cell activation after coculture with WT3-MR1 cells pulsed with cecal contents from the indicated mice (n = 14 mice per group; data pooled from N = 3). ***P < 0.001, **P < 0.01 by unpaired multiple t tests with FDR = 1%. (D) MAIT ligand concentrations expressed as 5-OP-RU equivalent (n = 14 mice per group, data pooled from N = 3). **P < 0.01 and ****P < 0.0001 by unpaired Mann-Whitney U tests. (E) qPCR-based estimation of cecal bacterial numbers in the indicated mice. n = 8 mice per group, N = 1. **P < 0.01 by unpaired Mann–Whitney U test.

