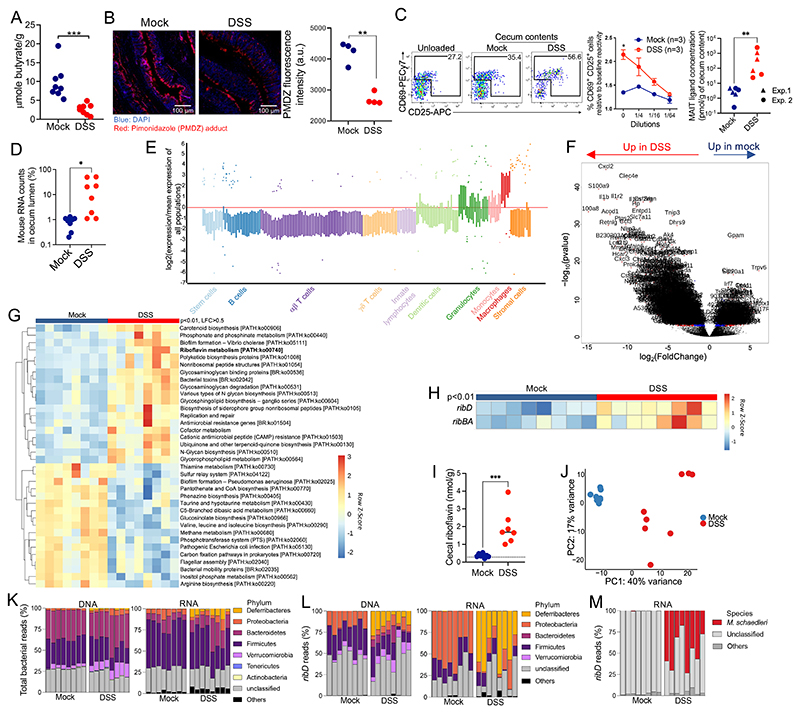
Fig. 3. Intestinal inflammation triggers riboflavin and MAIT ligand production by the microbiota.
(A) cecal butyrate concentrations in control (mock) and DSS-treated mice. n = 8 mice, N = 1. ***P < 0.001 by unpaired Student’s t test. (B) left, PMDZ adduct (red) and DNA (blue) staining in the colon. White bars represent 100 μm. Right, quantification of PMDZ staining at colon epithelium surfaces (each dot summarizes data from one mouse. Data representative of N = 2. **P < 0.01 by unpaired Student’s t test. (C) left, MR1:5-OP-RU–specific TCR Tg T cell activation after coculture with WT3-MR1 cells pulsed with cecal contents from control or DSS-treated mice (means ± SEMs, n = 3 mice per group, representative of N = 2). *P < 0.05 by unpaired multiple t tests with an FDR = 1%. Right, Mait ligand concentrations expressed as 5-OP-RU equivalent (n = 6 mice per group, data pooled from N = 2). **P < 0.01 by unpaired Mann-Whitney U test. (D) Percentage of mouse transcripts in ceca from the indicated mice. *P < 0.05 by unpaired Mann-Whitney U test. (E) Predicted cell-type enrichment in the cecum lumen upon DSS treatment (see Materials and Methods). (F) Differentially expressed mouse genes in the cecum lumen upon DSS treatment. (G) Bacterial metabolic pathways differentially expressed between control and DSS-treated mice (Padj < 0.01 by Mann-Whitney U test, LFC > 0.5). (H) Differentially expressed riboflavin biosynthetic pathway transcripts between control and DSS-treated mice (Padj < 0.01 by Mann-Whitney U test). (I) cecal riboflavin concentration (n = 7 or 8 mice per group, representative of N = 2). the dotted line indicates the plasma riboflavin concentration at steady state. ***P < 0.001 by unpaired Student’s t test. (J) PCA of cecal DNA reads at the family level in control and DSS-treated mice. (K) Phylum-level taxonomy of total bacterial DNA (left) or RNA (right) reads from the cecum. (L) Phylum-level taxonomy of ribD DNA (left) or RNA (right) reads from the cecum. (M) Species-level taxonomy of ribD transcripts.

