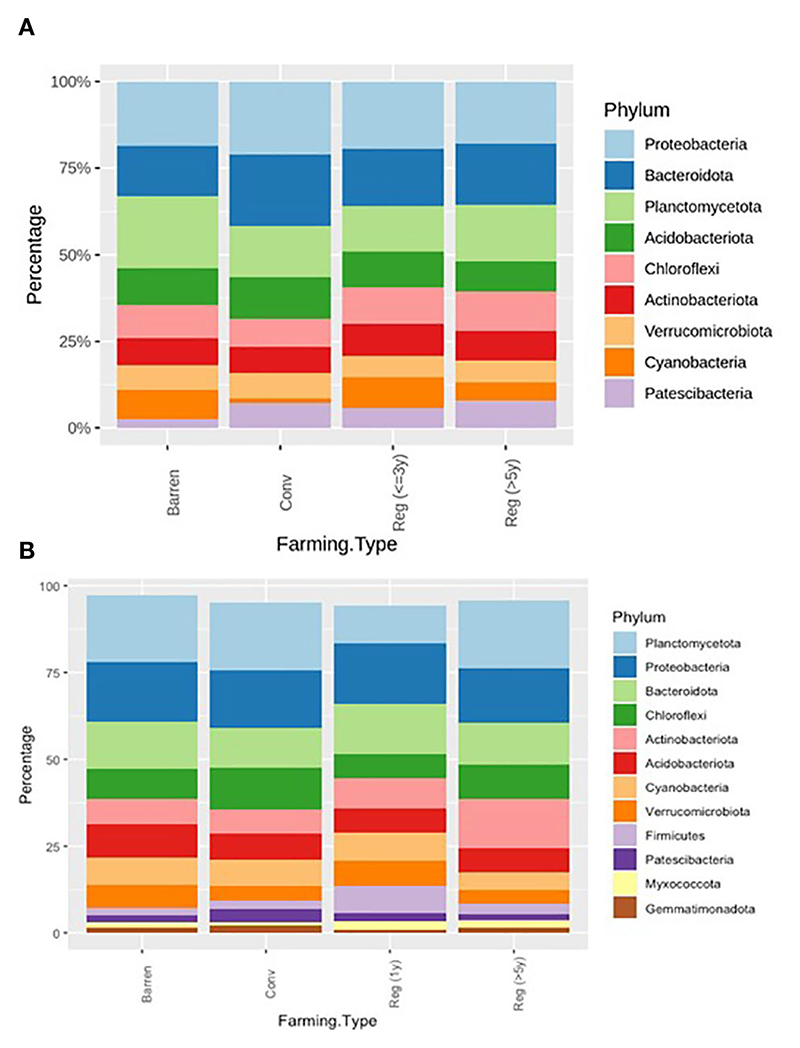
Figure 3.
(A) Relative bacterial abundance at phylum levels in Conventional (Conv) and Regenerative (Reg) agriculture plots and BL in (A) Vegetable plots and in (B) Ragi plots. In RV versus CV – Cyanobacteria, Firmicutes and Gemmatimonadota had p < 0.05; In RV vs. BL – Proteobacteria, Planctomycetota, Chloroflexi and Gemmatimonadota had p < 0.05; In CV vs. BL – Proteobacteria, Planctomycetota, Acidobacteria, Chloroflexi and Cyanobacteria had p < 0.05; In RR vs CR – Myxococcota had p < 0.05.

