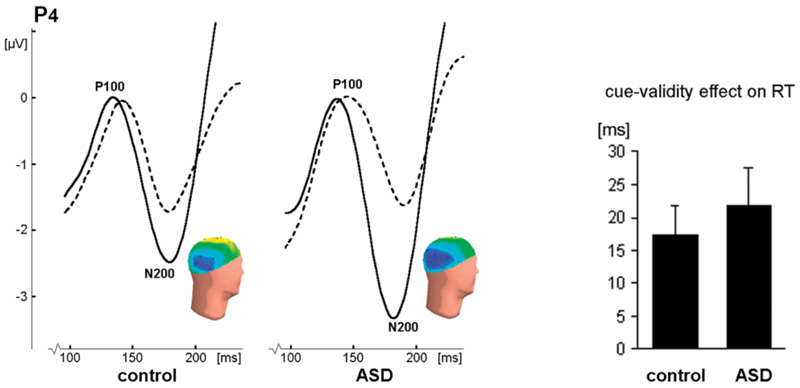
Figure 4. Results of the neutral-to-neutral condition, showing no impairments in ASD.
On the left: P100 and N200 peaks in response to correctly cued (solid lines) and incorrectly cued (dashed lines) targets at electrode P4 (right hemisphere). The peaks are earlier and larger for correctly cued targets, though the P100 amplitude effect is only evident in the left hemisphere (see Table 3), which is not shown here. Inset: heads show the distribution of N200 activity to correctly cued targets (negativity in blue, positivity in yellow). On the right: The cue-validity effect (± SE) on reaction times (RT), given as the RT to incorrectly cued targets minus the RT to correctly cued targets. This effect did not differ between the subject groups.

