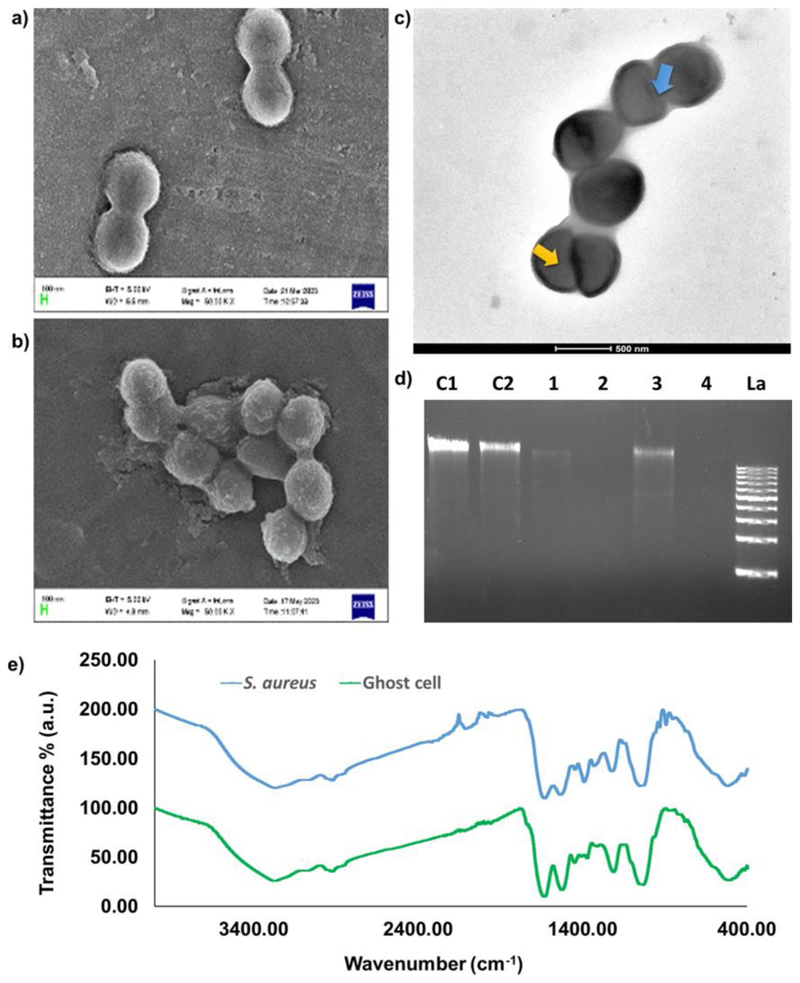
Fig. 2.
Scanning electron microscopic images of bacterial cells (a) control (live S. aureus) and (b) treated (S. aureus ghost cells) with observable size reduction under 10,000 X magnification. (c) Transmission electron microscopic images of ghost cells with decreased internal density (indicated by yellow arrow), increased transparency and intact cell wall. On the surface of the ghost cell small notches could also be seen (indicated by blue arrow). (d) Agarose gel electrophoresis image showing the reduction in DNA content in ghost cell samples compared to the respective control from two different culture volumes and time points (C1-untreated 100 mL, C2-untreated 50 mL, 1–50 mL culture plus 5 min iodine treatment, 2–50 mL culture plus 10 min iodine treatment, 3-100 mL culture plus 5 min iodine treatment, 4-100 mL culture plus 10 min iodine treatment, La-DNA ladder 1 kb). (e) FT-IR spectra of lyophilized samples of untreated bacterial cells (S. aureus) and treated ghost cells with characteristic peaks between the range 4000 cm−1 to 400 cm−1

