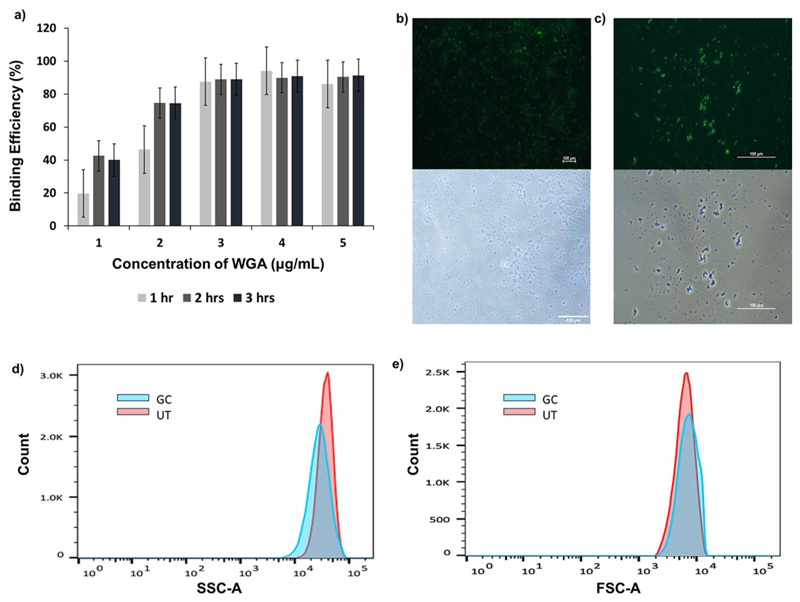
Fig. 3.
(a) Comparison of the binding efficiency of WGA-Alexa Flour 488 stain using a spectrofluorometer with concentrations ranging from 1 to 5 µg/mL at three different time points (1 h, 2 h, and 3 h), quantified in terms of percentage intensity in the supernatant. (b) Fluorescence microscopy images of WGA Alexa Flour 488-stained untreated cells (S. aureus) and (c) GC samples under 20X magnification. Lower panel of (b) and (c) show bright field images of the respective regions. (d) and (e) are side scatter and forward scatter plots obtained for assessing granularity and size respectively of ghost cells in comparison to live bacterial cells

