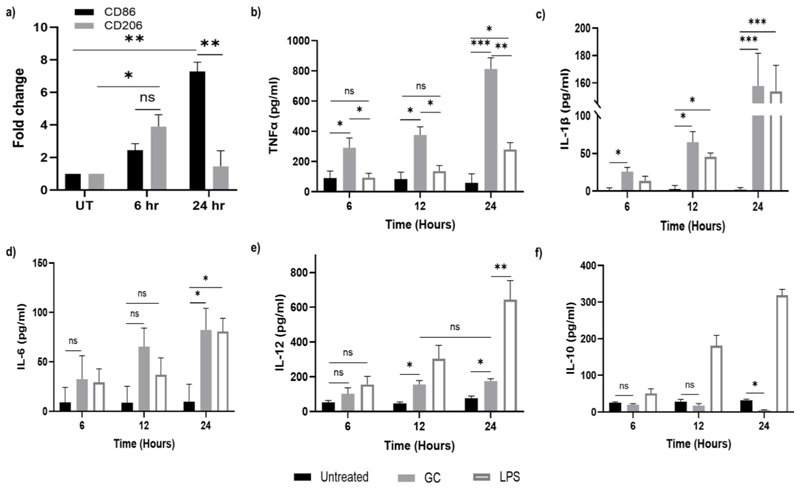
Fig. 5.
(a) Gene expression levels of CD86 and CD206, markers for M1 and M2 -subtypes respectively performed using qPCR after incubation with 100 ng/ml of GC. The results were normalized and are shown as fold changes relative to gene expression in untreated control cells. Quantification of cytokines (b) Quantification of TNF-α in GC or LPS- treated (positive control) supernatants compared to untreated control (negative control) at different time intervals performed via sandwich ELISA. (c) IL-1β, (d) IL-6, (e) IL-12p70 and (f) IL-10 in supernatants of 100 ng/ml GC or LPS -treated naïve macrophages in a time-dependent manner via sandwich ELISA. Data represented as mean ± SD from 3 independent experiments. p-values: * <0.05, **<0.01, *** <0.005

