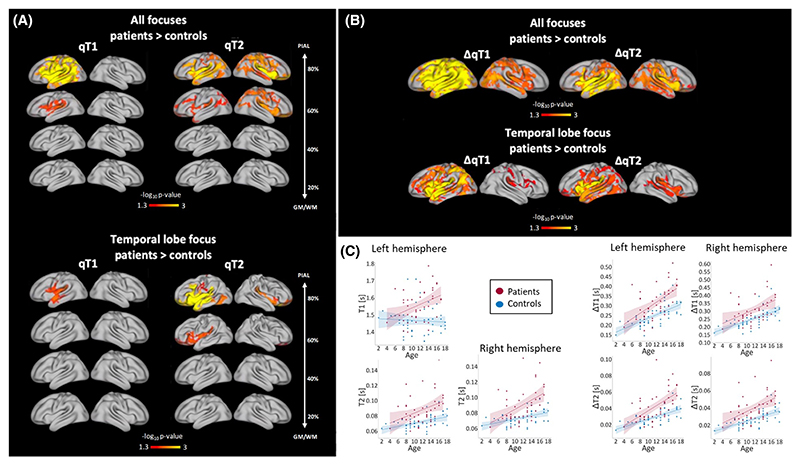
Figure 3.
(A) Group differences between patients and healthy controls in qT1 and qT2 at each cortical depth. When comparing all patients against controls, qT1 increases were detected in the ipsilateral hemisphere at 60% and 80% depth in patients, and bilateral increases were detected in qT2 at 60% and 80% depth. When splitting patients into frontal versus temporal lobe focus, qT1 increases were detected in the ipsilateral temporal lobe in temporal lobe epilepsy (TLE) patients compared to controls. Additionally, qT2 increases were detected at 60% and 80% distance in TLE patients compared to controls. (B) Group differences in qT1 and qT2 gradients (ΔqT1 and ΔqT2). When comparing all patients against controls, widespread steeper qT1 and qT2 gradients were detected in patients across both hemispheres. When splitting patients into subgroups based on focus, widespread steeper qT1 and qT2 gradients were detected in TLE patients compared to controls. Alterations extended beyond the temporal lobe. (C) Relationship between age and average qT1 and qT2 values in patients and controls. In the left panel, average qT1 and qT2 values at 80% distance from the gray/white matter (GM/WM) border are plotted for each subject against age in areas where significant group differences were detected. On the right, average qT1 and qT2 gradient values are plotted against age for each subject, again in areas where significant group differences were detected.

