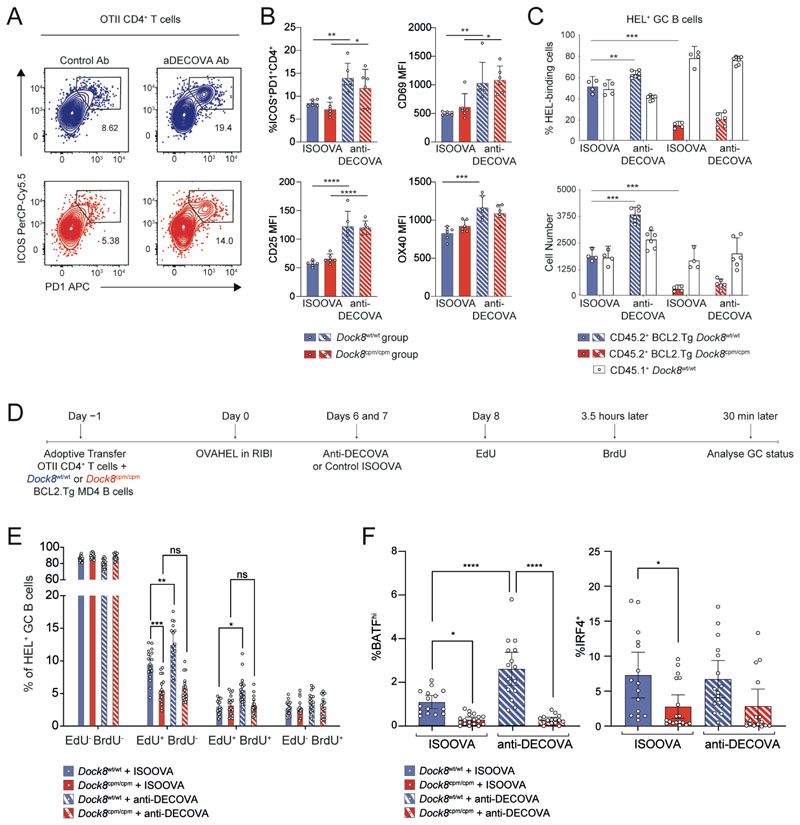
Fig. 4. DOCK8-deficient GC B cells are deficient in acquiring T cell help.
(A to C) CD45.2+ Dock8wt/wt or Dock8cpm/cpm BCL2.Tg GFP+ MD4 splenic B cells were mixed 50:50 with CD45.1+ Dock8wt/wt MD4 splenic B cells, and transferred with WT OTII CD4 T cells into CD45.1+ Dock8wt/wt C57BL/6 recipients one day prior to immunization with OVAHEL antigen. Either ISOOVA or anti-DECOVA antibodies were administered on days 6 and 7 post-immunization, and splenic GC status was evaluated on day 8. (A) Representative contour plots for WT TCRVα2+ CD45.2+CD4+ OTII splenic T cells from Dock8wt/wt (top, in blue) or Dock8cpm/cpm (bottom, in red). (B) Proportion of ICOS+PD1+CD4+ TFH cells with their activation status. Data are representative of two independent experiments with 4–6 mice per group. (C) Ratios (top) and cell numbers (bottom) of CD45.1+ Dock8wt/wt and CD45.2+GFP+ BCL2.Tg Dock8wt/wt or Dock8cpm/cpm HEL+ GC B cells from ISOOVA and anti-DECOVA groups. Data are representative of four independent experiments with n = 4–6 mice per group. (D) Schematic for adoptive transfer of Dock8wt/wt or Dock8cpm/cpm BCL2.Tg GFP+ MD4 splenic B cells mixed with WT OTII CD4 T cells one day prior to immunization with OVAHEL. Mice received antibody treatment and EdU/BrdU at indicated time points before analysis of splenic GC status. (E) Proportion of EdU- and/or BrdU-labeled and (F) proportion of BATFhi or IRF4+CD45.2+ HEL+ GC B cells from mice treated as in (D). Data are pooled from three independent experiments with n = 4–7 mice per group. (B, C, E, and F) Symbols indicate individual mice and error bars indicate 95% confidence intervals. Statistical analyses using ANOVA with Tukey’s or Šídák’s multiple-comparison test are reported with *P<0.05, **P<0.01, ***P<0.001, and ****P<0.0001.

