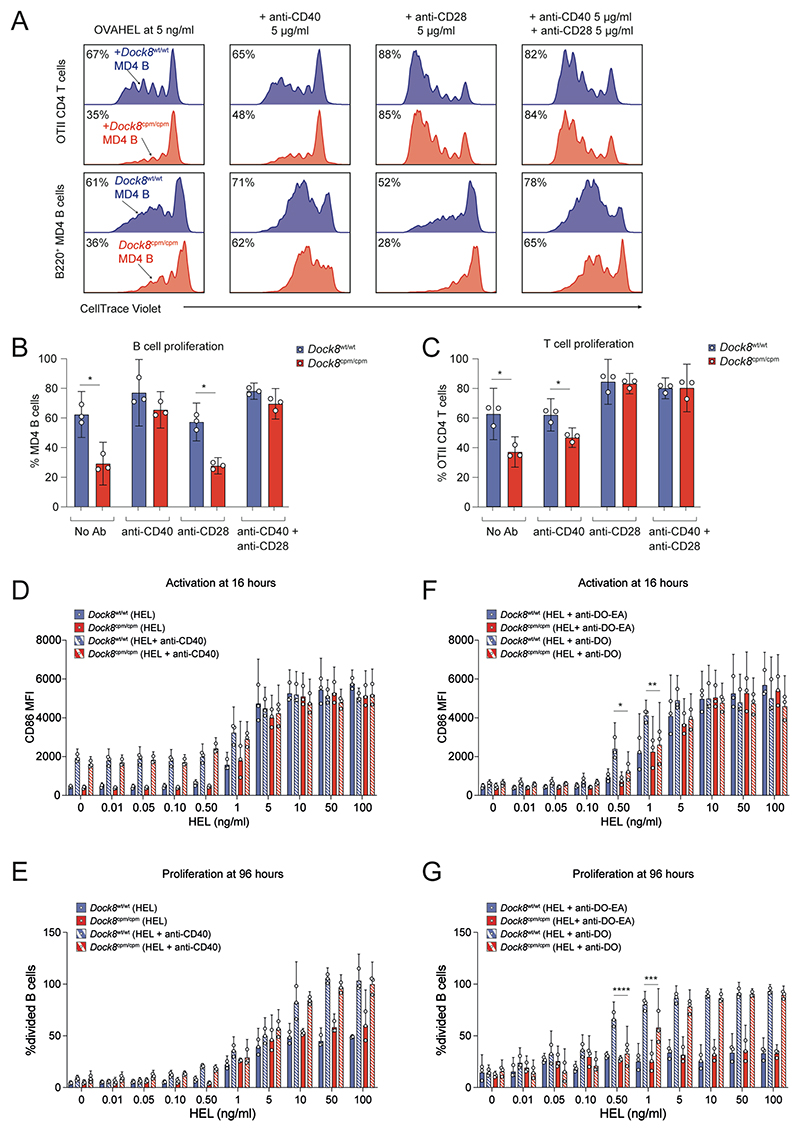
Fig. 6. B cells require DOCK8 to integrate costimulatory signals and T cell help.
(A to C) Mixtures of CD45.1+ Dock8wt/wt (blue) and CD45.2+ Dock8cpm/cpm (red) MD4 splenic B cells with WT OTII CD4 T cells were labeled with CTV and activated with 5 ng/ml of OVAHEL. (A) Proliferation of OTII CD4 T cells (upper panel) and MD4 B cells (lower panel) was assayed by CTV dilution at 96 hours in the presence of 5 μg/ml each of anti-CD40 or anti-CD28 or a combination of both. Numbers indicate proportion of cells that have proliferated, rounded to nearest integer. Pooled proliferation data for (B) MD4 B cells and (C) OTII CD4 T cells at 96 hours. Cells from two mice per group were used for each experiment and data are pooled from three independent experiments. Data were analyzed by unpaired t test with Welch’s correction, and with *P<0.05. (D to G) CTV-labeled mixtures of Dock8wt/wt (blue) or Dock8cpm/cpm (red) MD4 splenic B cells with OTII CD4 T cells were cultured with indicated HEL amounts. Pooled data for (D) CD86 expression and (E) proliferation of MD4 B cells with or without 5 μg/ml of anti-CD40. Pooled data for (F) CD86 expression and (G) proliferation of MD4 B cells in the presence of 10 μg/ml each of anti-DECOVA (DO) or anti-DECOVA-EA (DO-EA). Data were analyzed using two-way ANOVA with Šídák’s multiple comparisons test. Statistics are reported as *P<0.05, **P<0.01, ***P<0.001, and ****P <0.0001. (B to G) Cells were pooled from n = 2–3 donor mice per group per experiment and data are pooled from three independent experiments. Symbols indicate data from individual experiments, bars show means, and error bars indicate 95% confidence intervals.

