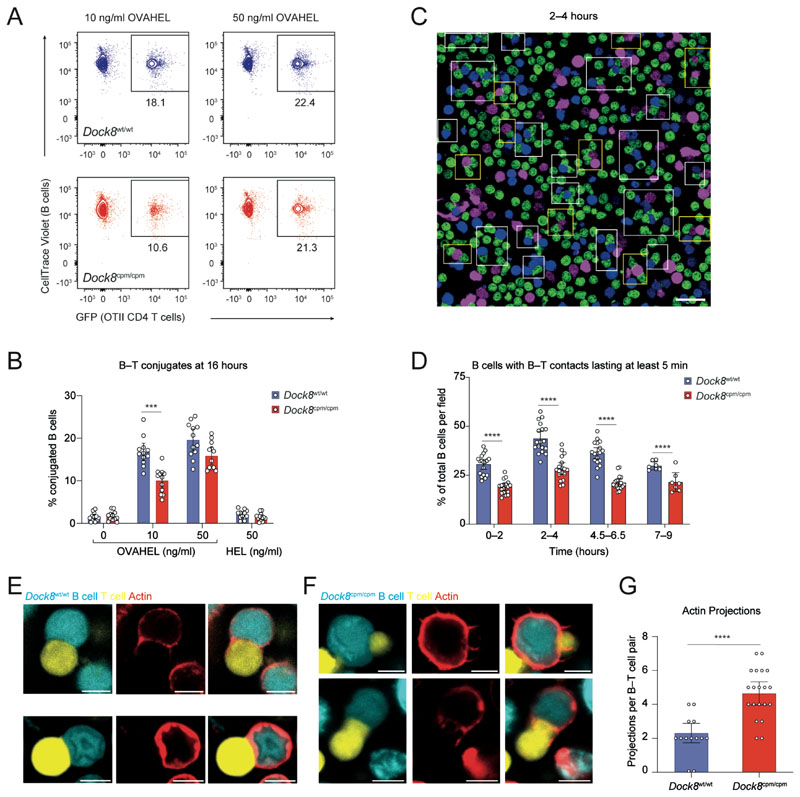
Fig. 7. DOCK8 sustains long-lasting B and T cell contacts when antigen is limiting.
(A and B) Purified CTV-labeled Dock8wt/wt or Dock8cpm/cpm MD4 splenic B cells were cultured with GFP+ OTII CD4 T cells and the indicated antigens. B–T cell conjugates quantified at 16 hours. (A) Representative plots and (B) pooled data from three experiments, each with n = 4 mice per group. Symbols indicate individual mice. (C and D) Dock8wt/wt (blue) or Dock8cpm/cpm (magenta) MD4 splenic B cells, incubated with 10 ng/ml of OVAHEL for 6–12 hours were mixed with OTII CD4 T cells (green). Images were recorded across 7–18 frames for 8–10 hours. (C) Representative image of B–T cell conjugates at 2–4 hours. White boxes indicate T cell conjugates with Dock8wt/wt B cells and yellow boxes with Dock8cpm/cpm B cells. (D) Proportion of B cells with B–T contacts lasting at least 5 min. Data are representative of three experiments. Cells were pooled from n = 2–3 mice per group and symbols indicate proportion of conjugates quantified per frame. (E to G) CFSE-labeled GC-like B cells (cyan), incubated with 10 ng/ml of OVAHEL for 6–12 hours and labeled with SiR-actin (red), were mixed with CTY-labeled OTII CD4 T cells (yellow) before recording B–T cell conjugates. Representative images for T cell conjugates with (E) Dock8wt/wt and (F) Dock8cpm/cpm B cells. (G) Data for actin projections at the interface of B–T cell conjugates, pooled from two experiments. Symbols indicate data from 13 Dock8wt/wt and 20 Dock8cpm/cpm B–T cell conjugates. Scale bars represent 20 μm for (C) and 5 μm for (E and F). For (B, D, and G) bars show means with 95% confidence intervals. Data analyzed by Welch’s t test (B and D) and Mann–Whitney test (G), with ***P<0.001 and ****P <0.0001.

