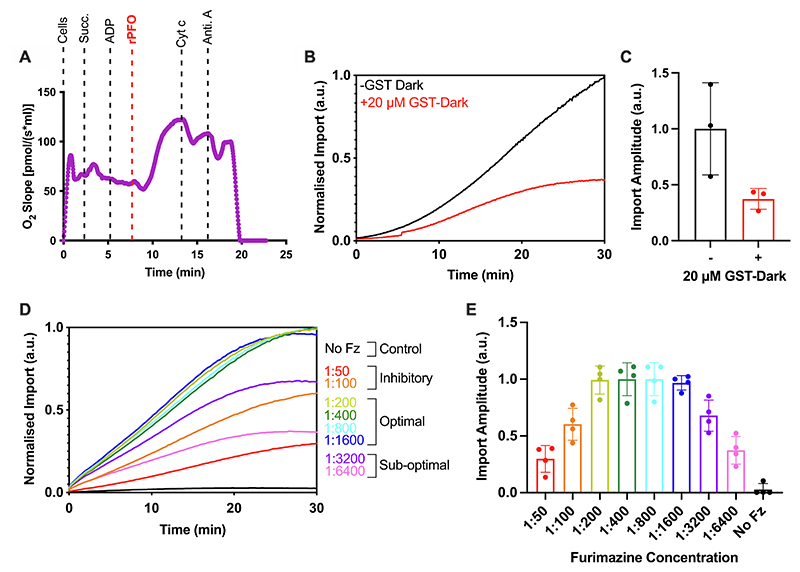
Figure 2. Permeabilised Cell MitoLuc Assay System Optimisation: rPFO, GST-Dark, and Furimazine.
(A) Oroboros oxygraph trace showing mitochondrial respiration in HeLa cells and the response to various stimuli/poisons. Cells are stimulated by addition of 5 mM succinate (Succ.) and 1 mM ADP prior to addition of 3 nM rPFO, which allows the substrates to access mitochondria. Cytochrome c (Cyt c; 10 μM) and antimycin A (Anti. A; 1 μM) are subsequently added, and the impact of these respiratory chain substrates on the oxygen consumption of the cells is measured. Representative trace shown. N = 3 biological repeats. (B) Average traces from the MitoLuc import assay in the absence (black) or presence (red) of 20 μM GST-Dark, added to cells 5 minutes prior to the assay. Background was removed and data was normalised to cellular eqFP670 expression, and the maximum amplitude from the run, to allow comparison between runs regardless of raw values. N = 3 biological repeats, each with n = 3 technical replicates. (C) Maximum amplitude plotted from average import traces displayed in (B). Error bars display SD. (D) Average traces from the MitoLuc import assay showing import with a titration of furimazine (Fz; dilutions indicated as ratios of furimazine: assay buffer). Fz was applied to cells for 5 minutes prior to starting the assay, the MitoLuc assay was then carried out with a Su9-EGFP-pep86 precursor. Data was normalised as described in (B). N = 4 biological repeats, each with n = 3 technical replicates. (E) Maximum amplitude plotted from average import traces displayed in (D). Error bars display SD.

