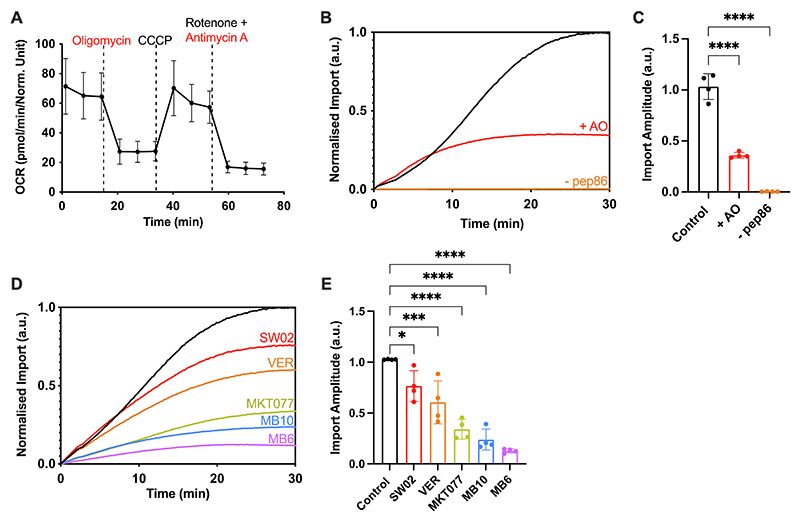
Figure 3. The Permeabilised MitoLuc Assay Monitors Import via the Presequence Pathway.
(A) Mitochondrial stress test showing oxygen consumption rate (OCR) of cells when subjected to various respiratory chain substrates. HeLaGAL cells were grown for 48 hours prior to carrying out mitochondrial stress tests on a Seahorse XFe96. 1.5 μM oligomycin, 0.5 μM CCCP, 0.5 μM antimycin A, and 0.5 μM rotenone were added and their impact on mitochondrial oxygen consumption was measured. Data was normalised to cell density according to an SRB assay. N = 6 biological repeats, each with n = 3 technical replicates. (B) MitoLuc import trace for Su9-EGFP-pep86 in the absence (black) or presence (red) of PMF inhibitor AO (1 μM antimycin A, 5 μM oligomycin), or in the absence of pep86 containing precursor (orange). AO was applied to appropriate wells for 5 minutes prior to monitoring the import of the precursor (Su9-EGFP-pep86) using the MitoLuc assay. Resulting normalised average traces are shown. N = 4 biological repeats, each with n = 3 technical replicates. (C) Maximum amplitude plotted from average traces shown in (B). Error bars display SD. One-way ANOVA and Tukey’s post hoc test were used. (D) MitoLuc import traces in the presence of small molecule inhibitors of the import machinery. No drug (black), SW02 (20 μM, red), VER (20 μM, orange), MKT077 (20 μM, green), MB10 (30 μM, blue), or MB6 (10 μM, purple) were applied to cells for 5 minutes prior to starting the assay, the MitoLuc assay was then used to monitor import of a purified precursor (Su9-EGFP-pep86). Resulting normalised average traces are shown. N = 4 biological repeats, each with n = 3 technical replicates. (E) Maximum amplitude plotted from average traces shown in (D). Error bars display SD. One-way ANOVA and Tukey’s post hoc test were used to determine significance.

