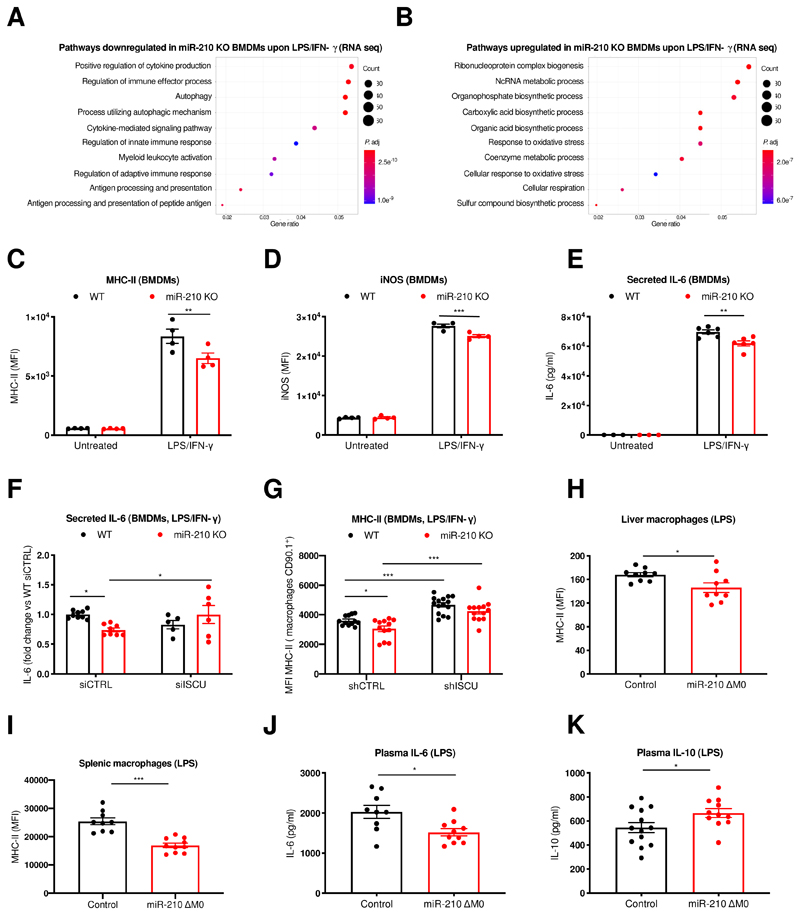
Fig. 6. MiR-210 deletion in macrophages counters inflammatory pathways and activation markers in response to endotoxin.
(A and B) Top 10 GO terms enriched, based on gene ratio, for significantly downregulated (A) and upregulated (B) genes in miR-210 KO versus WT BMDMs after 42-hour LPS/IFN-γ stimulation. Colour of the dots indicates adjusted P value. (C and D) MFI of MHC-II (C) and iNOS (D) of WT and miR-210 KO BMDMs, untreated or after 24-hour LPS/IFN-γ. (E) IL-6 concentration (MSD) in the medium of WT and miR-210 KO BMDMs, untreated or after 12-hour LPS/IFN-γ. (F) Fold changes of IL-6 (ELISA) in the medium of WT and miR-210 KO BMDMs after 24-hour LPS/IFN-γ. BMDMs were electroporated 48 hours before LPS/IFN-γ treatment with 2 siRNAs against ISCU or a control sequence. (G) MFI of MHC-II of WT and miR-210 KO BMDMs after 24-hour LPS/IFN-γ. Macrophages were transduced with a shRNA against ISCU or a control sequence. (H) MFI of MHC-II in liver macrophages (CD45+, CD11b+, Ly6G-, F4/80+) from Control (n=9) and miR-210 ΔM0 (n=9) mice. (I) MFI of MHC-II in spleen macrophages (CD45+, CD11b+, Ly6G-, MHC-II+) from Control (n=9) and miR-210 ΔM0 (n=10) mice. (J and K) IL-6 and IL-10 concentration (ELISA) in the plasma of Control (n=9-13) and miR-210 ΔM0 (n=10-11) mice. In vivo analysis was performed 18 hours after sublethal LPS i.p. injection (H-K). Data show a representative of three (C and D) or a pool of two (E, H to K), three (F) or five (G) independent experiments. P value was assessed by two-way ANOVA with Sidak’s multiple comparisons test (C-G) and two-tailed, unpaired, Student’s t-test (H-K). Statistical analysis: *p< 0.05; **p< 0.01; ***p< 0.001; graphs show mean ± SEM.

