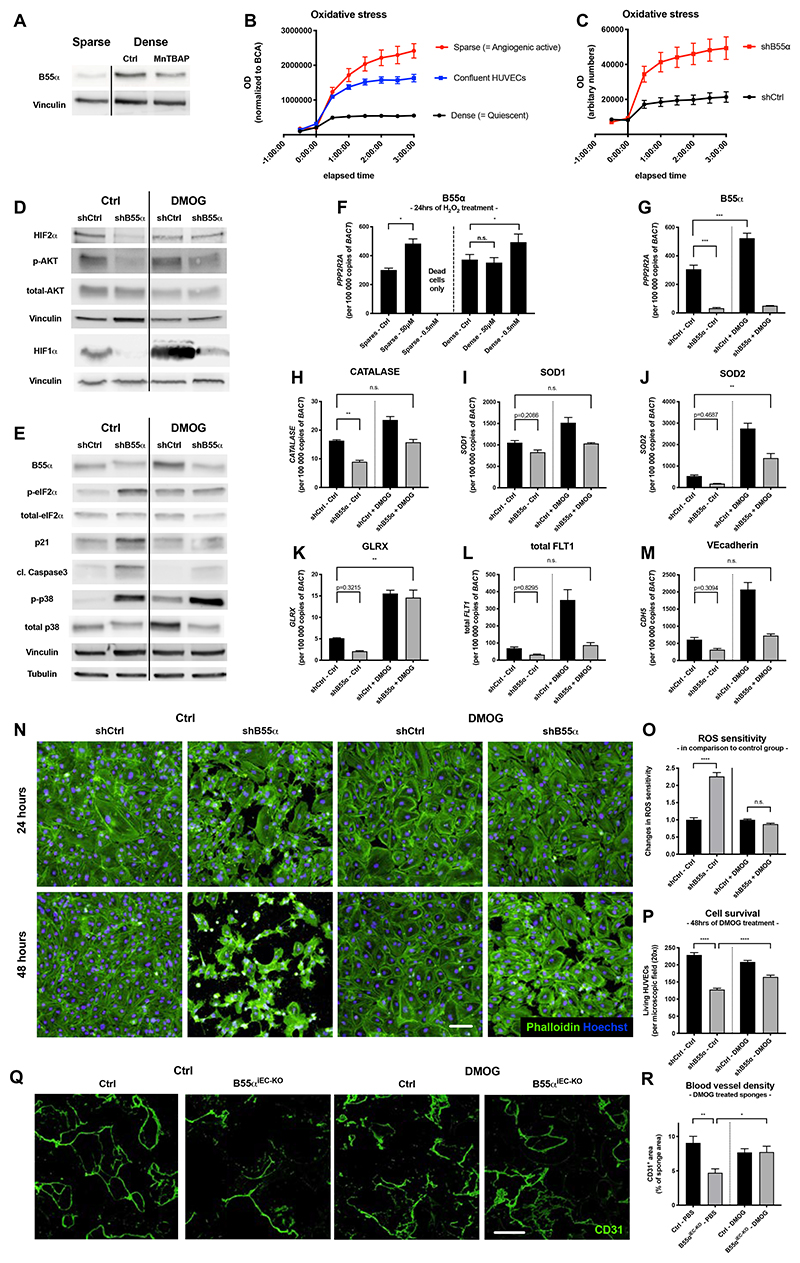
Figure 7. B55α induces cell protection against ROS and cell stress partially in a PHD dependent manner.
(A) WBs showing that the upregulation of B55α under dense conditions can be partially inhibited with the ROS scavenger MnTBAP
(B) ROS sensitivity assay analyzing the differential effects of H2O2-induced ROS on sparse, confluent and dense HUVECs.
(C) Analysis of ROS sensitivity in qVD treated HUVECs showing the differential response of B55α-KD HUVECs to H2O2 induced ROS-stress under dense conditions.
(D,E) WB analysis of different proteins indicating increased cell stress (such as p-eIF2α and p21), proteins involved in counteracting cell stress (HIF1α, HIF2α, p-AKT) and the apoptosis marker cleaved Caspase3 in B55α-KD and DMOG treated HUVECs.
(F-M) qPCR-based expression analysis of B55α (F,G), genes counteracting ROS (Catalase (H), SOD1 (I), SOD2 (J), GLRX (K)) and EC maturation markers such as total Vegfr1 (L), and VEcadherin (M).
(N-P) Staining of Phalloidin and Hoechst in DMOG treated B55α-KD and control HUVECs (Scale bar: 100µm) (N) and quantification of the increased resistance to H2O2 (O) and cell survival (P).
(Q,R) Representative images of sponges stained for CD31+ blood vessels (Scale bar: 300µm)
(Q) and quantification thereof (n = 6 per group) (R).
P values are *p<0,05; **p<0,001; ***p<0,001; ****p<0,0001.
Graphs show standard error of the mean (SEM).

