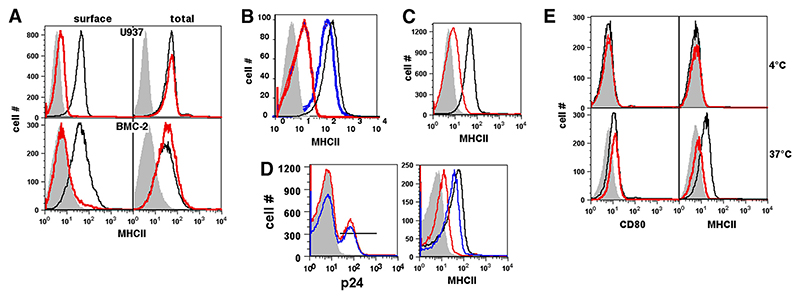
Figure 1. HIV-1 Nef reduces cell surface but not total MHCII levels on human and mouse myeloid cells.
A, U937 or BMC-2 cells were transfected to express either eGFP alone (black lines) or Nef and eGFP (red lines) and stained 24 h later for MHCII either before (surface) or after (total) permeabilization. Histograms show MHCII levels on eGFP-gated cells. B, U937 cells were either mock infected (black line) or infected with WT HIV-1 (NL4-3; blue line) or with nef-deleted NL4-3 virus (red line) and stained for cell surface MHCII and intracellular HIV-1 p24 protein 2 days later. Histograms show surface MHCII levels on p24-gated cells. C, Primary human monocytes were transfected to express either eGFP alone (black lines) or Nef and eGFP (blue lines) and stained 24 h later for cell surface MHCII. Histograms show MHCII levels on eGFP-gated cells. D, Primary human monocytes were either mock infected (black line) or infected with WT HIV-1 (NL4-3 Ada; red line) or nef-deleted NL4-3 Ada virus (blue line) and stained for cell surface MHCII and intracellular HIV-1 p24 protein 2 days later. Histograms in the left panel show p24 levels in infected cells and the p24 gate used. Histograms in the right panel show surface MHCII levels on p24-gated cells. E, U937 cells transfected to express either eGFP alone (black lines) or Nef and eGFP (red lines) were stained 12 h after transfection with anti-MHCII-biotin or anti-CD80-biotin, and held at either 4°C or 37°C as indicated. Cells were then stained with the same anti-MHCII or anti-CD80 mAbs conjugated to PE to detect newly expressed molecules. Histograms show levels of new MHCII or CD80 molecules delivered to the cell surface as detected by PE-labeled mAbs in eGFP-gated cells. Gray curves in all panels represent isotype controls. Data are representative of 3–5 independent experiments.

