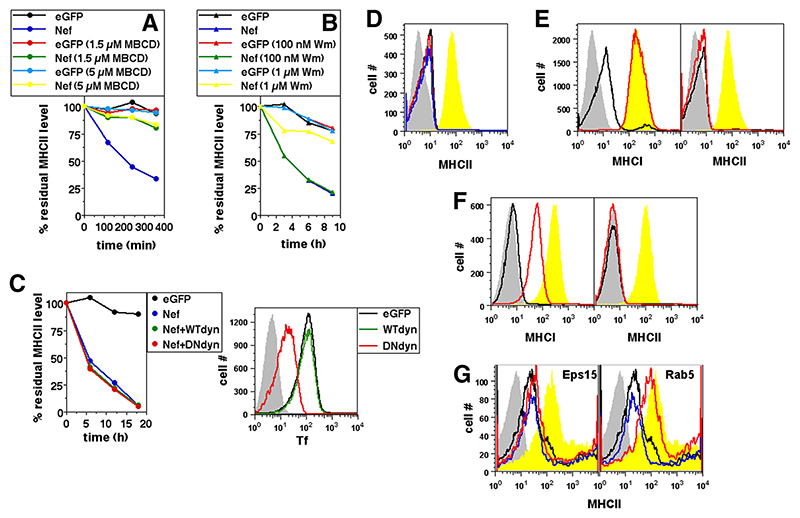
Figure 4. Nef-mediated removal of cell surface MHCII is dependent on cholesterol and PIK but is independent of Dyn, Eps15, or intersectin.
A and B, U937 cells transfected to express either eGFP alone or Nef and GFP were cultured in the presence or absence of various concentrations of MBCD (A) or Wm (B) as indicated. Cells were stained with anti-MHCII 12 h later and cultured for various times as shown before detection of the residual cell surface label. Mean fluorescence intensities were calculated for eGFP-gated cells and the data normalized to the starting intensities as a percentage of the residue of surface-labeled MHCII as shown. C, U937 cells were transfected to express either eGFP or Nef and GFP and WT Dyn or DN Dyn as shown. Cells were stained with anti-MHCII 12 h after transfection and cultured for various times as shown before detection of the residual cell surface label. Mean fluorescence intensities were calculated for eGFP-gated cells and the data normalized to the starting intensities as a percentage of the residue of surface-labeled MHCII as shown (left panel). Right panel shows U937 cells transfected to express eGFP alone or with either WT Dyn or DN Dyn as indicated and given a 10-min pulse with fluorophore-labeled Tf 3 h before staining. Histograms show Tf uptake levels in eGFP-gated cells. Gray curves indicate isotype controls. D, U937 cells were transfected to express either eGFP alone (yellow curves) or Nef-positive GFP alone (black line) or with either control plasmid (blue line) or sh-Dyn (red line). Cells were stained 24 h later for MHCII. Histograms show surface MHCII levels on eGFP-gated cells. Gray curves indicate isotype controls. E and F, U937 cells were transfected to express either eGFP alone (yellow curves) or Nef and GFP alone (black line) or with DN eps15 (red line; E) or intersectin-A (red line; F). Cells were stained 24 h later for cell surface MHCI or MHCII. Histograms show surface MHCI and MHCII levels on eGFP-gated cells. Gray curves indicate isotype controls. G, Human primary monocytes were either untransfected (yellow curves) or transfected to express Nef by itself (black line) or along with either WT Eps15 (left panel; blue line) or DN Eps-15 (left panel; red line) or WT Rab5 (right panel; blue line) or DN Rab5 (right panel, red line). Cells were stained 24 h later for MHCII. Histograms show surface MHCII levels on cells gated for expression of transfected gene/s. Gray curves indicate isotype controls.

