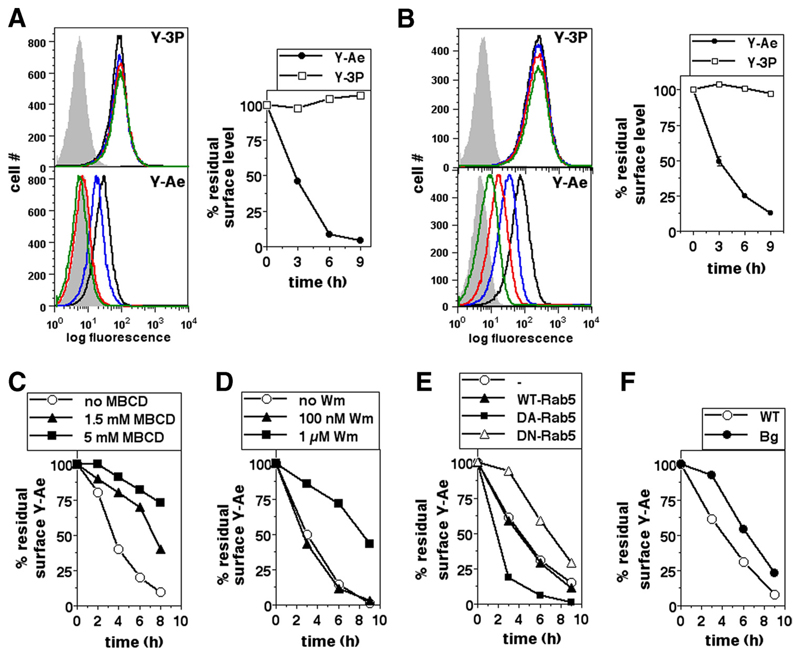
Figure 6. Peptide-MHCII complexes are removed from the cell surface by a mechanism at least partially dependent on cholesterol, PIK, Rab5, and Lyst.
A, BMC-2 cells were pulsed with Eap for 60 min and cultured for 0 h (black line), 3 h (blue line), 6 h (red line), or 9 h (green line) before staining with either the pMHCII-specific mAb Y-Ae or the H-2Ab -specific mAb Y-3P for flow cytometry. Gray curves indicate isotype controls. Mean fluorescence intensities were calculated for HAp-gated cells and the data normalized to the starting intensities as a percentage of the residue of surface label. B, BMC-2 cells were pulsed with Eap for 60 min and stained with either Y-Ae or Y-3P and cultured for 0 h (black line), 3 h (blue line), 6 h (red line), or 9 h (green line) before flow cytometric detection of residual cell surface label. Gray curves indicate isotype controls. Mean fluorescence intensities were calculated and the data normalized to the starting intensities as a percentage of the residue of surface label. C and D, BMC-2 cells were pulsed with Eap for 60 min and stained with either Y-Ae or Y-3P and cultured for various times in the presence or absence of various concentrations of MBCD (C) or Wm (D) as indicated before detection of the residual cell surface label. Mean fluorescence intensities were calculated and the data normalized to the starting intensities as a percentage of the residue of surface label. E, BMC-2 cells transfected to express either eGFP alone or with WT Rab5, CA Rab5, or DN Rab5 as indicated were pulsed with Eap for 60 min and stained with either Y-Ae or Y-3P and cultured for various times as shown before detection of the residual cell surface label. Mean fluorescence intensities were calculated and the data normalized to the starting intensities as a percentage of the residue of the surface label. F, BMDMs derived from WT C57BL/6 or bg/bg (Bg) mice were pulsed with Eap for 60 min and stained with either Y-Ae or Y-3P and cultured for various times as indicated before detection of residual cell surface label. Mean fluorescence intensities were calculated and the data normalized to the starting intensities as a percentage of the residue of surface label.

