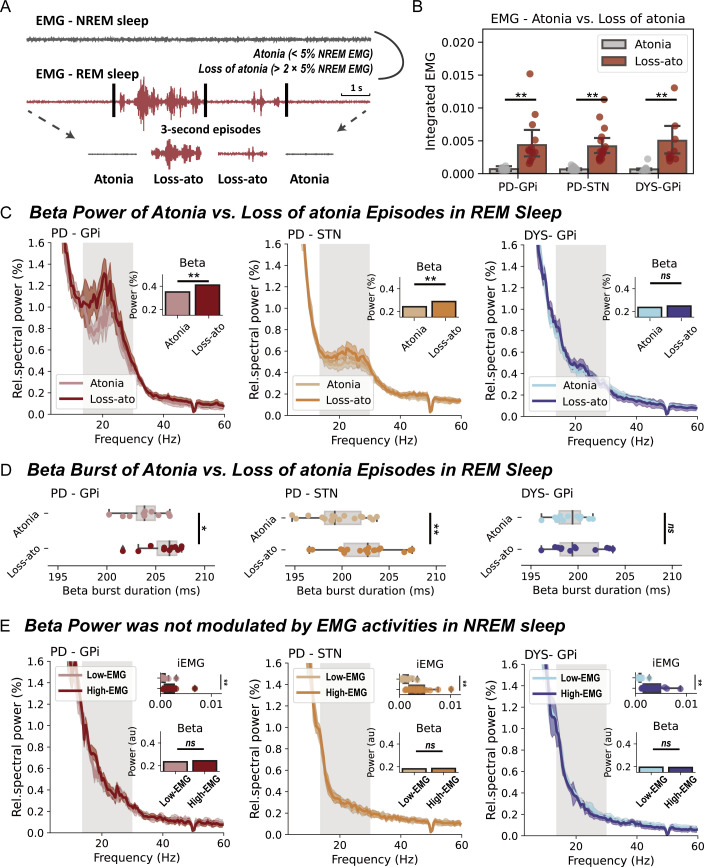
Figure 2.
Basal ganglia beta power during rapid eye movement (REM) sleep with and without atonia. (A) A diagram that demonstrates how REM sleep with/without atonia is determined. (B) The integrated electromyogram (EMG) is compared between atonia and loss of atonia REM sleep episodes in three groups of patients. All bar plots indicate mean±SEM. For Parkinson’s disease (PD)-globus pallidus internus (GPi), p=0.002; for PD-subthalamic nucleus (STN), p=7.63×10⁻⁶; for dystonia (DYS)-GPi, p=4.88×10⁻⁴, Wilcoxon signed-rank test. (C) The average power spectra and beta power in atonia and loss of atonia REM sleep episodes in three groups of patients. The shaded area indicates SEM. The beta band range is highlighted in grey. **P<0.01. ns, non-significant. Wilcoxon signed-rank test. (D) Beta burst durations in atonia and loss of atonia REM sleep episodes in three groups of patients. For box plots, the lower and upper borders of the box represent the 25th and 75th percentiles, respectively. The centerline represents the median. The whiskers extend to the smallest and largest data points that are not outliers (1.5 times the IQR). For PD-GPi, p=0.042; for PD-STN, p=5.04×10⁻⁴; for DYS-GPi, p=0.519, Wilcoxon signed-rank test. (E) The integrated EMG, average power spectra and beta power in non-REM (NREM) sleep episodes with below (low-EMG) and above median (high-EMG) EMG activities in three groups of patients. For the comparison of integrated EMG, p=9.76×10⁻⁴ for PD-GPi; p=1.53×10⁻⁵ for PD-STN; and p=4.88×10⁻⁴ for DYS-GPi. For the comparison of beta power, p=0.278 for PD-GPi; p=0.927 for PD-STN; and p=0.791 for DYS-GPi. Wilcoxon signed-rank test. **P<0.01. ns, non-significant.

