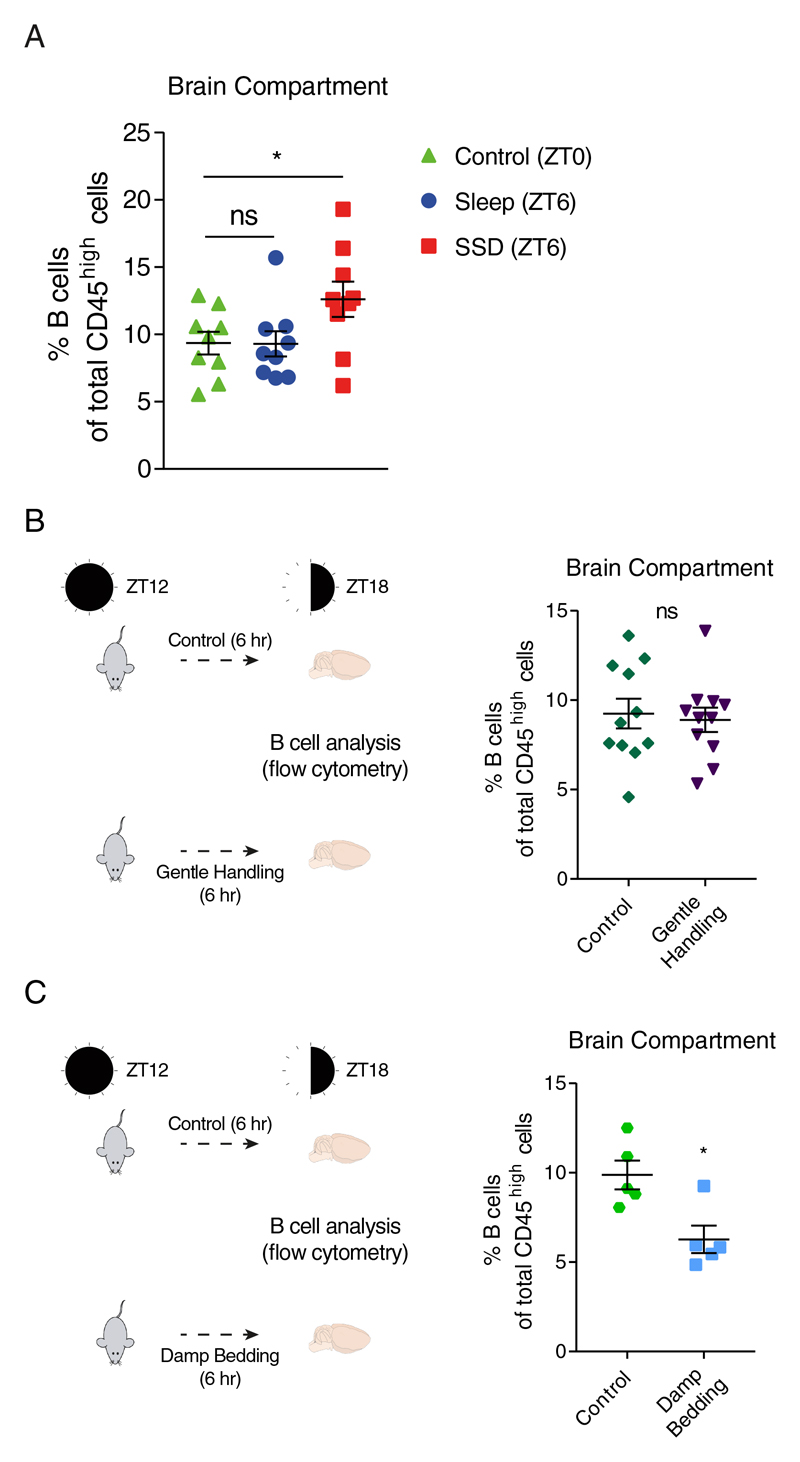
Figure 2. Comparison of B cell proportions in the brain compartment at baseline conditions (ZT0), and validation of the effects of gentle handling and stress during waking hours (ZT12-ZT18) on B cell proportion in the brain compartment.
Flow cytometry analysis. (A) The percentage of B cells (CD45high/+CD19+MHC-II+) of total CD45high cells at ZT0 (control; green triangle), and following 6 hours of sleep (ZT6; blue circle) or sleep deprivation (SSD; ZT6; red square). Data are presented as mean±sem; one-way ANOVA followed by Fisher’s LSD, n=9 individual mice; *P<0.05; data of two experiments. (B) Mice were housed normally or gently handled for 6 hours (ZT12-ZT18), and the percentage of B cells in the brain compartments of total blood-derived cells was analyzed using flow cytometry. Data are presented as mean±sem; Student’s t-test, n=11 individual mice; P>0.747; data of two experiments. (C) Mice were housed normally or exposed to damp bedding for 6 hours (ZT12-ZT18), and the percentage of B cells in the brain compartments of total blood-derived cells was analyzed using flow cytometry. Data are presented as mean±sem; Student’s t-test, n=5 individual mice; *P<0.05. ns, not significant.

