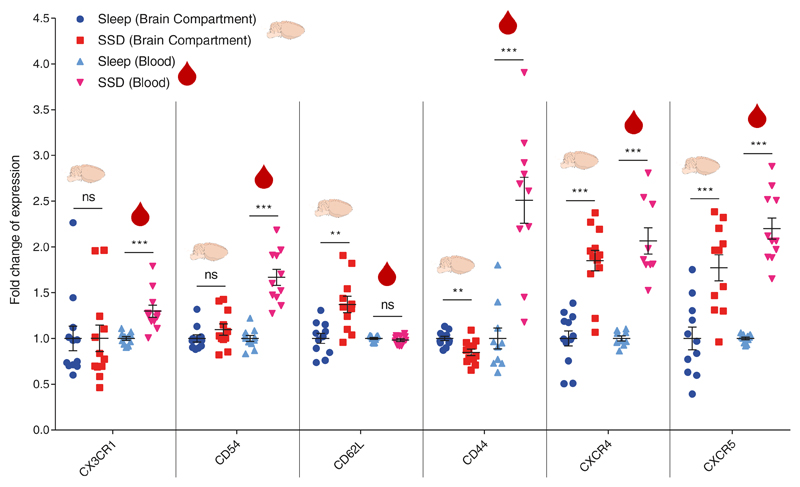
Figure 3. Characterization of a B cell migration phenotype in the brain compartment and blood following short-term sleep deprivation.
Flow cytometry analysis. Fold change of expression in migration-related markers (CX3CR1, CD54, CD62L, CD44, CXCR4, CXCR5), in B cells isolated from the brain compartment or in B cells in the blood following 6 hours of sleep (sleep; blue circle) or sleep deprivation (SSD; red square). Fold change of expression was calculated by dividing each value with the mean value of the sleep group for each experiment. Data are presented as mean±sem; Student’s t-test, n=9-12 individual mice; **P<0.01; ***P<0.001; data of two experiments. ns, not significant.

