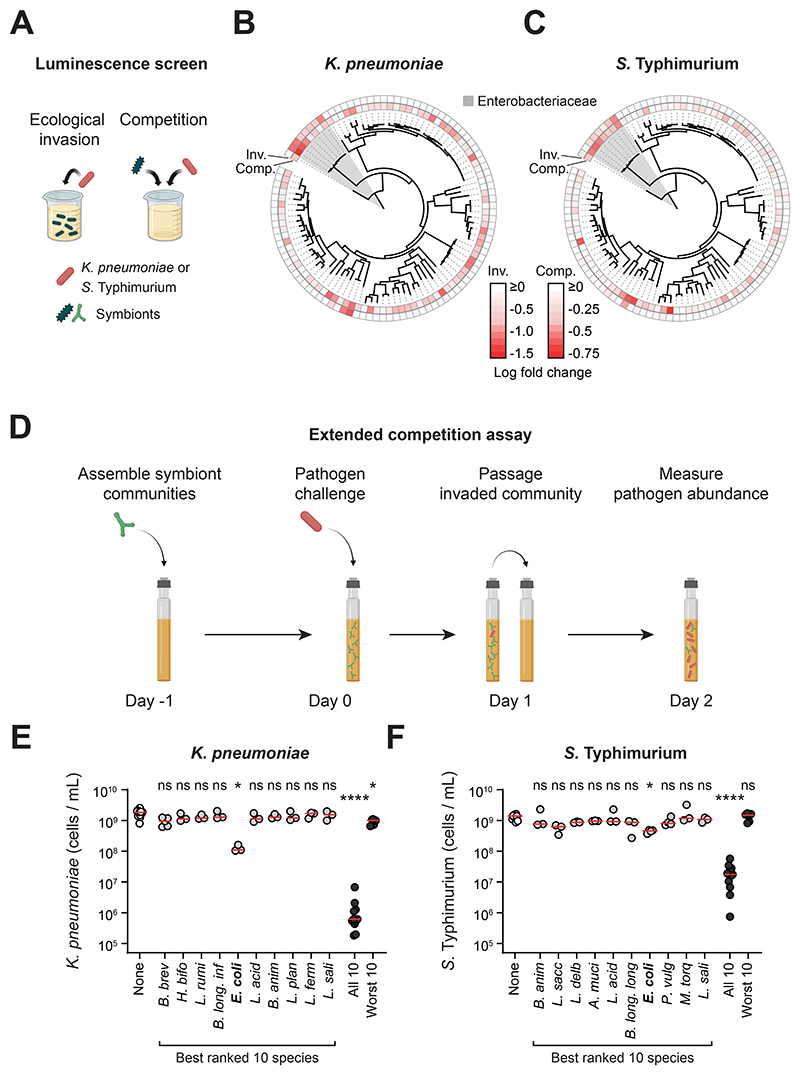
Figure 1. Single strains do not provide robust colonization resistance, but a diverse community can, depending on its composition.
A) Overview of the luminescence co-culture assays. In the ecological invasion assay, K. pneumoniae or S. Typhimurium (red) was inoculated in co-culture with individual symbionts (different green symbols are used to represent the diversity of symbiont species screened; 19:1 ratio of symbiont to pathogen). In the competition assay, the symbionts were inoculated at an equal ratio to the pathogen to recapitulate competition between strains once the pathogen is established. In both assays, luminescence produced by the pathogen was used as a proxy for pathogen growth. Created with BioRender.com. B-C) Comparison of phylogenetic relatedness between symbionts, and the ability of each symbiont to compete with the pathogen (inv=ecological invasion assay; comp=competition assay). Data for K. pneumoniae shown in (B) and S. Typhimurium shown in (C). The family Enterobacteriaceae, which includes both K. pneumoniae and S. Typhimurium, is shaded in grey. Luminescence fold change values are presented in Fig. S1. Data presented as the median luminescence log fold change of N=3-10 independent experiments (biological replicates). Strains with the most negative (most red) values inhibited growth of the pathogen most strongly. D) Overview of the extended competition assay. Communities (or individual strains; green) of symbionts are pre-grown in anaerobic rich media before addition of the pathogen (red). The community is passaged after 24h of growth, followed by another 24h of growth before quantification with flow cytometry. Created with BioRender.com. E-F) The extended competition assay was performed for each individual species identified in the best ranked 10 species, as well as for combinations of 10 species (both the best- and worst-ranked 10 species; Fig. S1). Individual biological replicates from N=3-15 independent experiments are shown. Red lines indicate the median. A Kruskal-Wallis test with Dunn’s multiple test correction compares each group to the no-symbionts control (p>0.05=ns; p<0.05=*; p<0.0001=****). Data for K. pneumoniae shown in (E) and S. Typhimurium shown in (F). See Table S1 for species name abbreviations.

