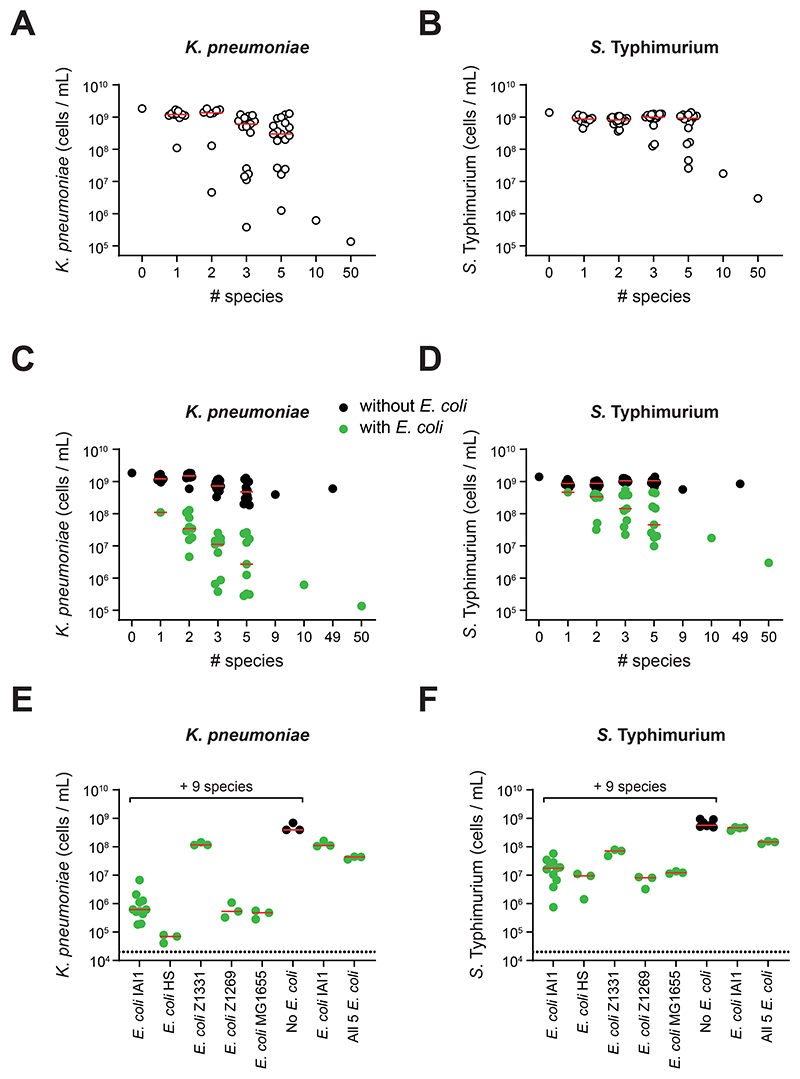
Figure 2. Ecological diversity and key members are needed for efficient colonization resistance in vitro.
A-D) Extended competition assay on communities made up of an increasing number of species. Each data point represents the median pathogen cells/mL value on day 2 of the extended competition for a community (n=3-15 biological replicates from independent experiments for each community; up to 17 communities for each group). Communities with size <= 10 species were randomly selected from the 10 best ranked species for each pathogen. Community identities are shown in Table S4-5. Data for K. pneumoniae shown in (A) and (C), and for S. Typhimurium shown in (B) and (D). Red lines indicate the median value of communities at a given diversity level. In C-D), data from A-B) are replotted along with additional communities that always contained E. coli but were otherwise randomly selected. Communities without E. coli are depicted in black; communities with E. coli in green. Separate red median lines shown for communities with and without E. coli. A linear regression is performed on log-log transformed data in Fig. S2a-b, which shows that the association between diversity and colonization observed is statistically significant, and that this effect is greater for communities with E. coli than those without (F tests, p≤0.0001). E-F) Extended competition assay testing E. coli strains substituted into the best ranked 10 species community. Data for K. pneumoniae shown (E) and S. Typhimurium in (F). Red lines indicate median values. Each data point represents a biological replicate each from independent experiments (N=3-11).

