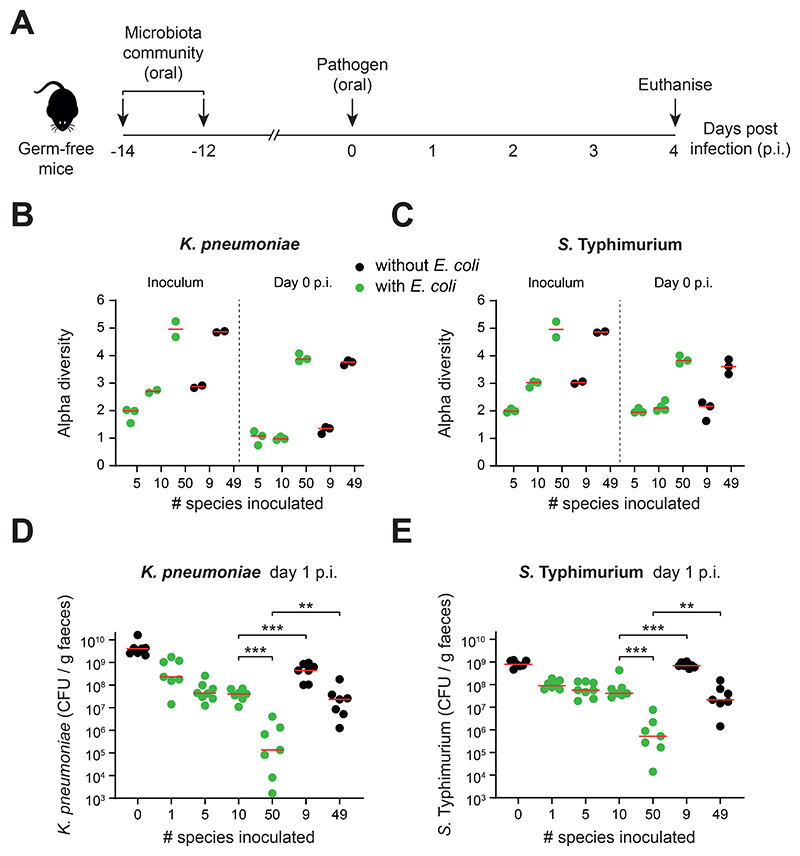
Figure 3. Ecological diversity and key members are needed for efficient colonization resistance in vivo.
A) Overview of gnotobiotic mouse experiments. Symbiont communities (or E. coli alone) were given to germ-free mice by oral gavage twice (two days apart). 12 days later, the mice were challenged with K. pneumoniae or S. Typhimurium by oral gavage. Feces were collected from mice daily before being euthanised on day 4 post infection (p.i.). B-C) Alpha diversity measured by Shannon index of symbiont communities. Metagenomic sequencing was performed on the inoculum and fecal samples at day 0 (when the pathogen is introduced) and used to calculate diversity. Data for K. pneumoniae shown in (B) and S. Typhimurium in (C). Biological replicates from a representative mouse from each cage are shown (N=2-4; at least two independent experiments). D-E) Pathogen abundances in the feces of gnotobiotic mice colonized with communities of increasing diversity (mice containing communities with E. coli shown in green; mice containing communities without E. coli shown in black; N=7-8 biological replicates of mice per group in cages of 2-3 mice; 2-3 independent experiments). Red lines indicate the medians. Two-tailed Mann-Whitney tests are used to compare the indicated groups (p<0.01=**; p<0.001=***). Data for K. pneumoniae shown in (D) and S. Typhimurium shown in (E). Metagenomic analysis of strain diversity and relative abundance is shown in Fig. S5. Pathogen abundance data from days 1-4 p.i. is shown in Fig. S6. Community compositions are shown in Table S6.

