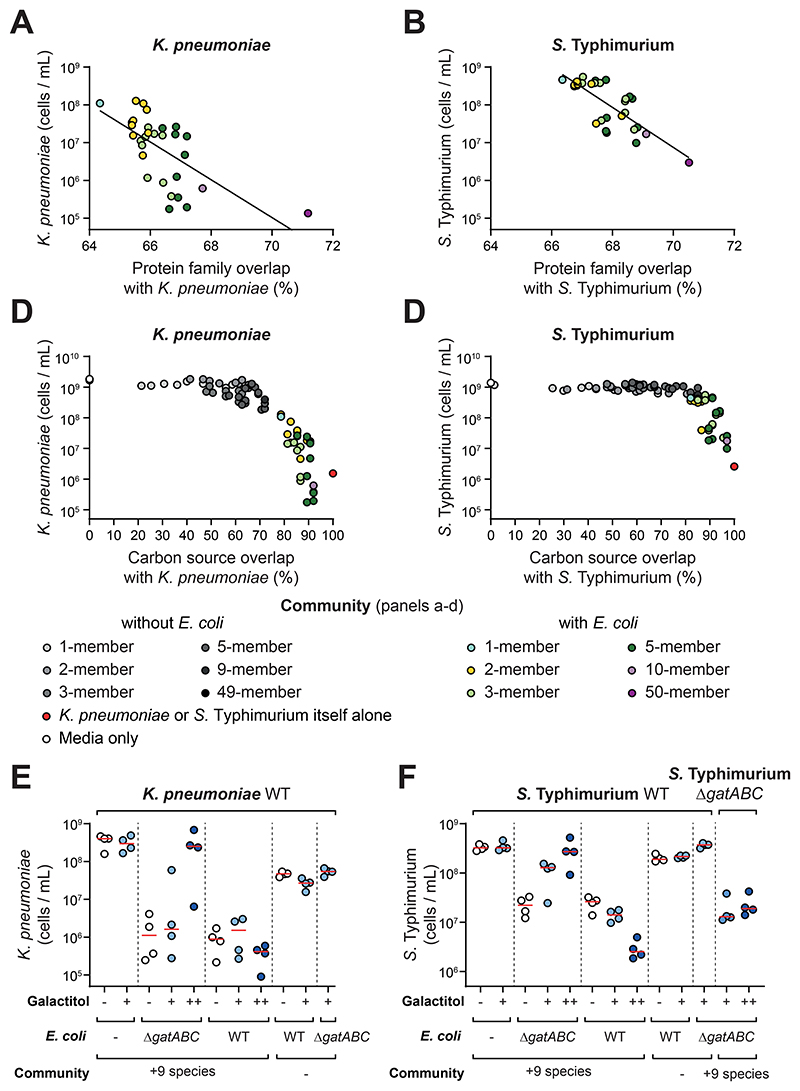
Figure 4. Nutrient overlap can explain the role of ecological diversity and the effect of E. coli in colonization resistance.
A-B) Protein family overlap is compared to the median pathogen abundance values for each community containing E. coli from Fig. 2C-D. Diversity is visualised by a color gradient. Data for K. pneumoniae shown in (A) and Salmonella shown in (B). A line of best fit is shown from a linear regression on log transformed data: R2 = 0.4255 for K. pneumoniae; R2 = 0.603 for S. Typhimurium; both slopes are significantly different from 0 using an F-test (p<0.0001). Data for communities without E. coli is presented in Fig. S9E-F. C-D. Overlap in carbon source utilisation plotted against the median pathogen abundance measurements from experimental communities in Fig. 2C-D. Community carbon source overlap is calculated using an additive approach from carbon source overlap of individual strains by measurement on AN Biolog Microplates (Fig. S10). Diversity is visualised by a gradient of color (for E. coli-containing communities) or greyscale (for communities without E. coli). A control with the isogenic pathogen itself (100% overlap) is plotted in red. Data for K. pneumoniae in (C) and S. Typhimurium shown in (D). E-F) A private nutrient, galactitol, that could only be used by the WT E. coli strain and the pathogens but not by the other symbionts nor an E. coli ΔgatABC mutant, was supplemented to the media and the extended competition assay performed as before. In all treatments, pathogen abundance was measured by flow cytometry after 48h of growth post-passage instead of the usual 24h. This change did not influence the control experiments without galactitol, but proved informative because we found the growth impacts of galactitol were relatively slow. Results for K. pneumoniae shown in (E) and S. Typhimurium in (F). N=3-4 biological replicates from independent experiments per treatment. Horizontal red lines show the median of the replicates. Light blue circles show results with 0.1% galactitol supplementation (+ symbol), dark blue circles show results with 1% galactitol supplementation (++ symbol). White circles (control) show results with no nutrient supplementation (- symbol). 9 species refers to the 9 additional species in the 10 best-performing species for each respective pathogen (- symbol refers to when E. coli is added alone). In (D), a ΔgatABC mutant of S. Typhimurium was used in addition to the WT pathogen to verify the dependency of colonization on a private nutrient.

