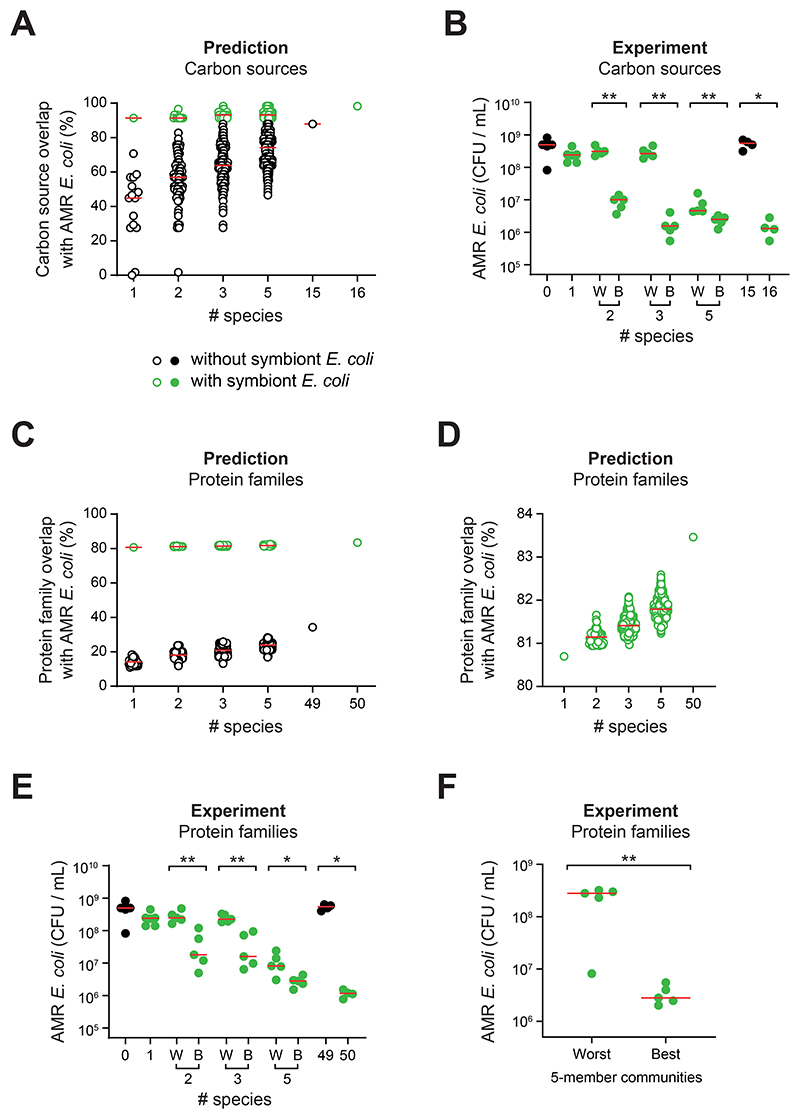
Figure 5. Nutrient blocking predicts community colonization resistance.
A) In silico prediction of carbon source overlap with the AMR E. coli strain for all possible combinations of symbiont communities at the indicated diversity levels. Each circle represents a different community. Communities containing the symbiont E. coli IAI1 are shown in green and communities without E. coli IAI1 are shown in black (predictions as hollow circles; experimental data as solid circles). Predicted carbon source overlap calculated using an additive approach from carbon source use of individual strains measured using AN Biolog MicroPlates (Fig. S10, S13). B) Experimental test of in silico predictions in (A). The two E. coli IAI1-containing communities predicted to have the best (B) and worst (W) carbon source overlap were picked at each diversity level and competed against AMR E. coli in the extended competition assay. A two-tailed Mann-Whitney U test was performed on community pairs (p>0.05=ns; p<0.05=*; p<0.01=**) at the 2-, 3- and 5-strain diversity levels. Red horizontal bars depict the median of each community tested. N=4-5 biological replicates from independent experiments for each community. C-D) In silico prediction of protein family overlap with the AMR E. coli strain for a random subset (n=59,043) of all possible symbiont communities at diversity levels 2-, 3-, and 5-strains, as well as all individual strains and the 49- and 50-species communities. Each circle represents a different community. Communities are selected from the strains comprising the 50-member community. Communities containing E. coli IAI1 are shown in green and communities without E. coli IAI1 are shown in black. D) Only the E. coli-containing communities are plotted to better visualise variation in protein family overlap. E) Experimental test of in silico predictions based on protein cluster overlap in (C-D). The two E. coli IAI1-containing communities predicted to have the best (B) and worst (W) protein family overlap were picked at each diversity level (randomly selected, for cases where there were multiple communities with the same overlap), and competed against AMR E. coli in the extended competition assay. Red horizontal bars depict the median of each community tested. N=5 biological replicates from independent experiments for each community. A two-tailed Mann-Whitney U test was performed on community pairs (p>0.05=ns; p<0.05=*; p<0.01=**) at the 2-, 3- and 5-strain diversity levels. F) Experimental test of the predicted 5 best and 5 worst communities at the 5-strain diversity level, based on protein family overlap with AMR E. coli. Each symbol represents the median of N=5 biological replicates from independent experiments per community. Red horizontal bars depict the median of the best and the worst predicted communities. A two-tailed Mann-Whitney U test was performed (p<0.01=**). Community identities for (B, E-F) are shown in Table S7.

