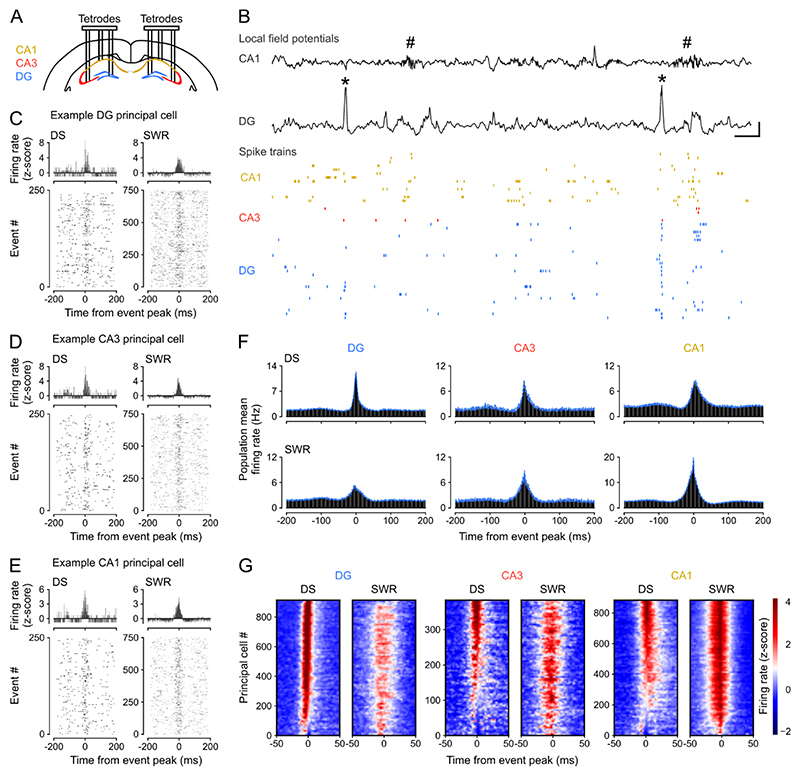
Figure 1. Dentate spikes recruit principal cell spiking across DG, CA3, and CA1.
(A) Triple-(DG-CA3-CA1) ensemble tetrode recording allowed simultaneous monitoring of local field potentials (LFPs) and spiking activities.
(B) Upper: raw wide-band CA1 and DG LFP traces (black) showing sharp-wave ripples (SWRs, hash symbols) in CA1 and dentate spikes (DSs, asterisks) in DG. Scale bars, 100 ms (horizontal), 1.5 mV for DG and 0.5 mV for CA1 (vertical). Lower: (color-coded) raster-plot of spike trains from CA1 (orange), CA3 (red), and DG (blue) principal cells (PCs, one cell per row). Shown is a few second sample of recording for clarity.
(C-E) Spiking responses from single example DG (C), CA3 (D), and CA1 (E) principal cells. Upper: Z-scored peri-event time histogram (PETH) during DSs (left) and SWRs (right). Lower: corresponding raster plot showing event-related spiking responses (one event per row).
(F) Group averaged firing rate PETHs for hippocampal PCs during DSs (top) and SWRs (bottom): DG (n=921), CA3 (n=388), CA1 (n=887) cells from 12 mice. Blue traces: mean ± SEM.
(G) Heatmaps showing z-scored firing rates for the DG, CA3, and CA1 PCs shown in (F). For each heatmap: one cell per row, sorted (top-to-bottom) from the most activated (highest z-score at event peak, 0 ms, red) to the least activated (lowest z-score at event peak, blue) during DSs.

