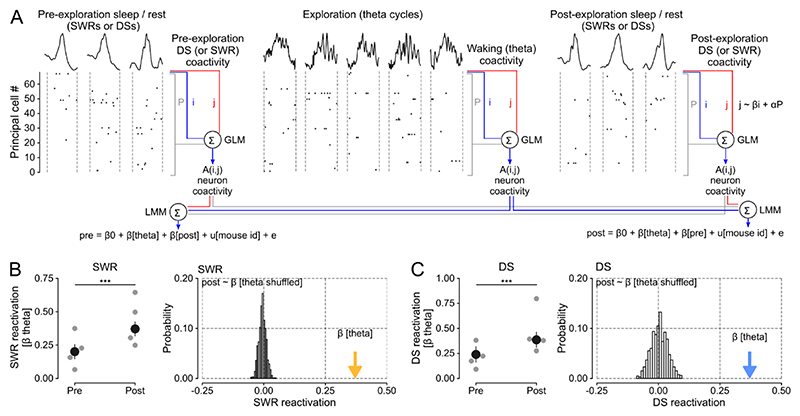
Figure 4. Waking patterns of hippocampal coactivity reactivate in offline DSs.
(A) DS and SWR reactivation of waking patterns formed by principal cell theta coactivity. For each cell pair (i, j), we predicted the spike discharge of neuron j from the activity of neuron i while regressing out the activity of the remaining population during pre-exploration sleep, exploration of open-field arenas, and post-exploration sleep (using GLMs as in Figure 3A). We separately applied this procedure for DSs and SWRs in both sleep/rest sessions (offline DS versus offline SWR coactivity), and across theta cycles in the exploration session (waking theta coactivity). This procedure returned a matrix of β regression weights that represented the neurons pairwise coactivity structure of the population in each session. We then used a Linear Mixed Model (LMM) to compare the waking theta coactivity with post-exploration sleep coactivity (in DSs or SWRs) while controlling for pre-exploration sleep coactivity (in DSs or SWRs), and vice versa (reverse model). We included mouse identity as a random factor in each LMM.
(B) SWR reactivation (measured by the β coefficients of the LMM that predicted post-exploration SWR coactivity from waking theta coactivity, controlling for pre-exploration SWR coactivity). Left: The β coefficient for theta coactivity was significantly higher when predicting post-exploration SWR coactivity than with the reverse model (i.e., predicting pre-exploration SWR coactivity from theta coactivity, controlling for post-exploration SWR coactivity). Gray points show the β coefficient for theta coactivity for individual mice. Error bars show ± 95% confidence interval. P-value from t-test comparing post versus pre β coefficients: t(7308) = 10.29; P < 0.0001. Right: The histogram shows the random probability distribution of β weights for theta coactivity when cell pair identity was shuffled (i.e., a null distribution based on 1,000 random shuffles; n=7,310 cell pairs from 4 mice). The colored arrow shows the actual β coefficient for theta coactivity.
(C) DS reactivation exhibited the same pattern of results as SWR reactivation, shown in B. P-value from t-test comparing post versus pre β coefficients t(7308) = 8.84; P < 0.0001.

